Ainslie Tuer, Applied Science
Abstract
In order to address the problem of rising sea levels and increased extreme weather events, this experiment involved constructing a small scale wave flume and various coastal defense models to study their effect on coastal erosion and flooding. As cities expand and the push for sustainability increases, coastal cities must look for innovative ways of managing their shorelines. Research is being done on new and current ways of preventing flooding. In this experiment a 1:50 scaled model of a shoreline with a slope of 1/2.8 is used for testing the properties of a vertical seawall, a reverberated seawall, and a boardwalk. These mechanisms were overall efficient at reducing flooding, ranging between 91-79% less water collected than the control. The best mechanism for flooding prevention was the vertical seawall, and the worst was the boardwalk. Although there was no significant erosion in either of the mechanisms, most likely due to time constraints and scaling effects, the boardwalk caused the least change in the beach profile, and the vertical seawall caused the most. Overall the results of this experiment indicate the choice of coastal defense mechanism is highly dependent on the need of the area and priority of erosion control or flooding control.
Introduction
Due to melting ice sheets and glaciers, between 1961 and 2009 the global mean sea level (GMSL) rose 1.9 ± 0.4 mm/year, and this rate is accelerating (Church & White, 2011). In Vancouver BC, sea level has risen 3.7 cm in the past century (British Columbia Ministry of Environment, 2016). As sea levels rise, extreme weather events increase, and coastal areas are being developed into cities, the topics of coastal erosion, coastal defense mechanisms, and flood prevention techniques are of increasing concern. This experiment relates to the problem of flooding and erosion in coastal cities. In this experiment a 1:50 length scaled wave flume is used to study various 3D printed models of coastal defense mechanisms and compare their effectiveness and impacts on the surrounding environment.
Coastal Defense
With climate change and growing cities coastal management techniques are becoming a growing concern, there has been some research done on coastal defense. There are four general approaches to coastal defense: Resist, Accommodate, Move, and Combination. Resisting involves building structures that keep the coastline at its current location by holding back water or redirecting wave energy. The vertical seawall and reverberated seawall are examples of this. Cities can accommodate short term flooding by building infrastructure that can function with temporarily increased water levels, for example a building raised on stilts. Cities can move farther up the shore and avoid at-risk areas for flooding. A city at risk for coastal storms might turn a frequently flooded area into a wetland park. In order to achieve the most effective approach, new coastal development projects are choosing to combine these three approaches (City of Vancouver, 2018).
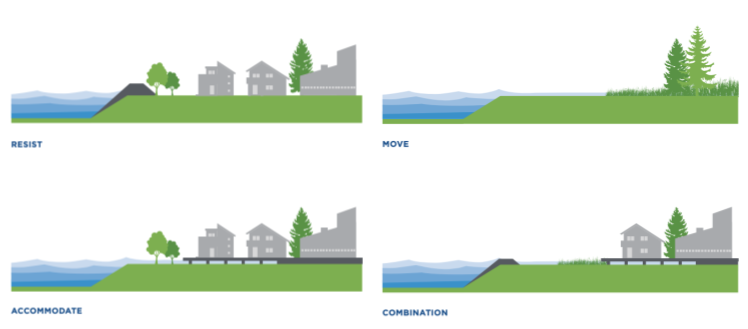
Figure 1. Infographic showing four possible approaches to coastal defense. (City of Vancouver, 2018).
More scientists and engineers are looking into natural defenses such as artificial reefs, seagrass beds, and mangroves. Based on a meta-analysis of 69 different studies, on average these strategies reduce wave heights between 35% and 71% (Narayan, 2016). Traditional methods of coastal defense such as vertical walls and groynes are now understood to be more costly and less sustainable than natural methods (Designing Buildings, 2022). Due to the scope and limitations of this experiment, only traditional methods were studied. Despite the increased usage of natural methods, traditional methods should still be studied to improve the baseline knowledge of their impacts and to create new, innovative solutions. Many studies done in the past on coastal defense mechanisms are based on long-term observation of specific areas rather than a short term, quantitative analysis. Percentages and quantitative data calculated in meta-analysis of long term studies can be compared to numbers found in this project to judge accuracy.
Waves and Physical Modeling
Typically there are three methods used to study coastal defense mechanisms: Case studies, computer and mathematical modeling, and physical modeling. Physical models can be a useful tool to study the effects of water levels, tides, currents, and waves on built structures, as well as coastal management techniques’ effect on flooding, erosion, and tsunamis. Physical models have advantages, namely their educational usefulness by providing a clear and interactive way to observe wave energy and its effects, as well as the ability to simulate a variety of situations without having to spend time and research on adapting mathematical formulas. However, due to scaling effects engineers cannot rely on physical models alone to study coastal defense (Hughes, 1995). Physical models in combination with case studies and computer simulations can provide coastal engineers with a clear method to study proposed designs and nearshore hydrodynamics (Briggs, 2013). This experiment used a physical model due to its low cost, flexibility, and educational value.
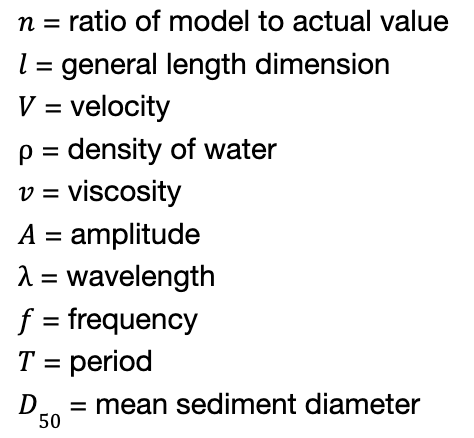
Figure 2. List of wave parameters and their associated variables.
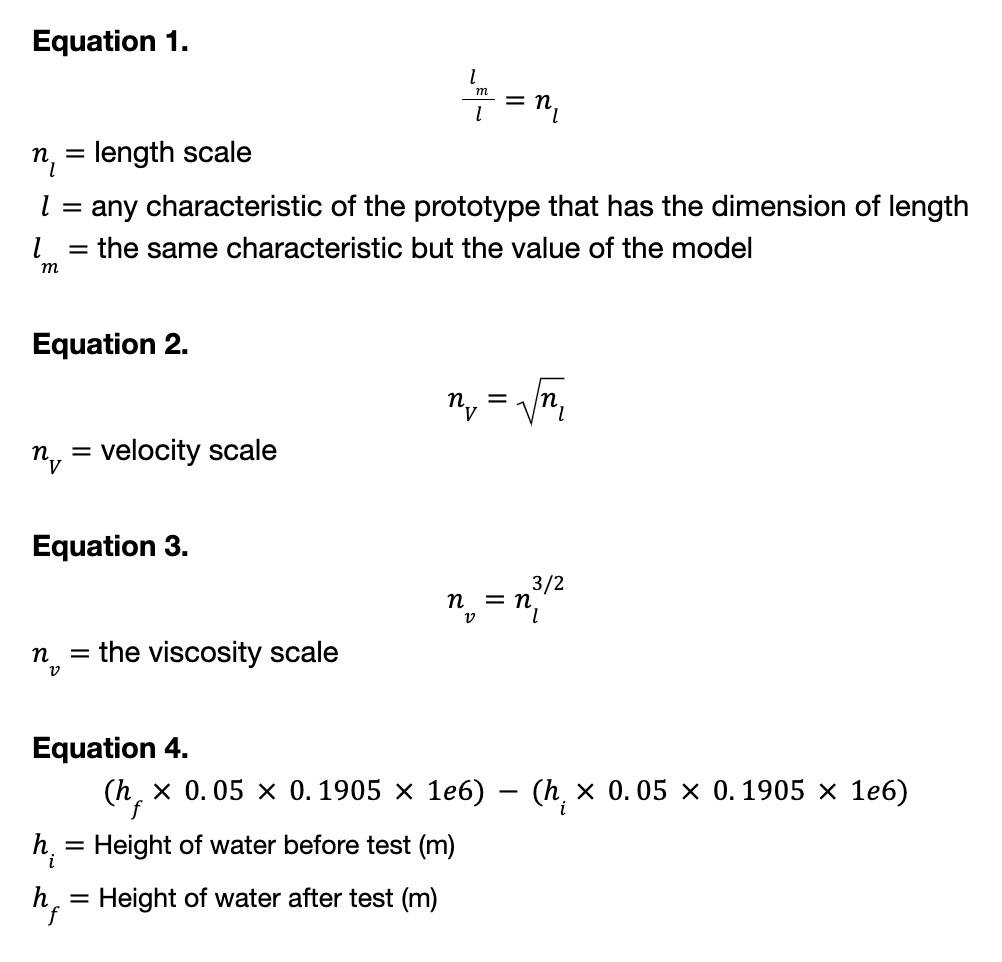
Before continuing this paper it is important to define the variables used (See figure 2). When designing physical models, the various different scales can generally be based off of the length scale. Determining the length scale is simple, however it should be less than 50:1 prototype to model (Saincher & Banerjee, 2015). The length scale is calculated using equation 1.
The velocity scale can be derived using the Froude number to be the square root of the length scale (See equation 2). Equation 3 can be derived using the Reynolds number (Young et al., 2010). Although the viscosity scale can be found, in practice it is hard or impossible to find fluids with the correct viscosity, so it is often ignored and the model is considered distorted (Briggs, 2013; Young et al., 2010). When water is used the density and viscosity are not scaled and will each equal one (Henriquez et al., 2008). Using just the length scale characteristics of the wave including wavelength and amplitude can be found. The velocity scale can be used to find the wave velocity. The velocity scale and length scale can be used to find the time scale which is equal to the square root of the length scale (See equation 2) (Young et al., 2010).
Materials and Methods
Wave flume construction
A 9.5mm thick piece of acrylic plexiglass was cut into eight pieces of various dimensions (see figure 3). Using 100% MONO silicone as adhesive, the wave flume was assembled to be a 1.24m long tank with two 12.70cm tall barriers 5.08cm from the end (see figure 3). After gluing the pieces together a bead of silicone was applied to all the inner seams for waterproofing. Two 2.38mm holes were drilled into opposite longer edges of the remaining piece of plexiglass 1 cm from the bottom, which were then used as the socket for the 3D printed hinge.
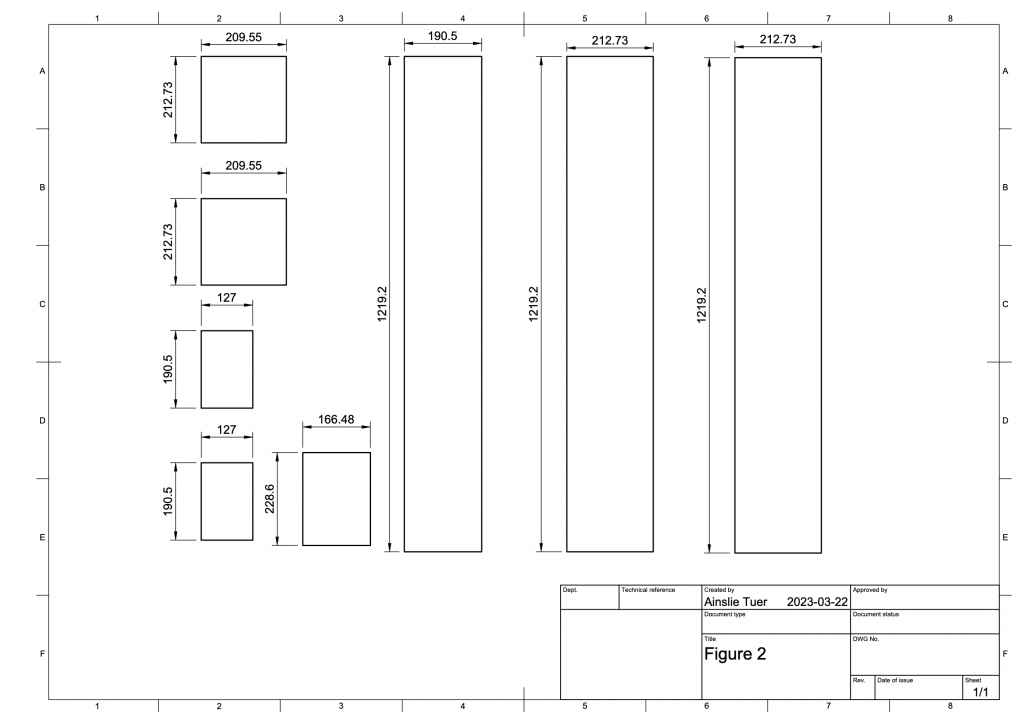
Figure 3. Drawing showing each piece of acrylic plexiglass with dimensions in millimeters.
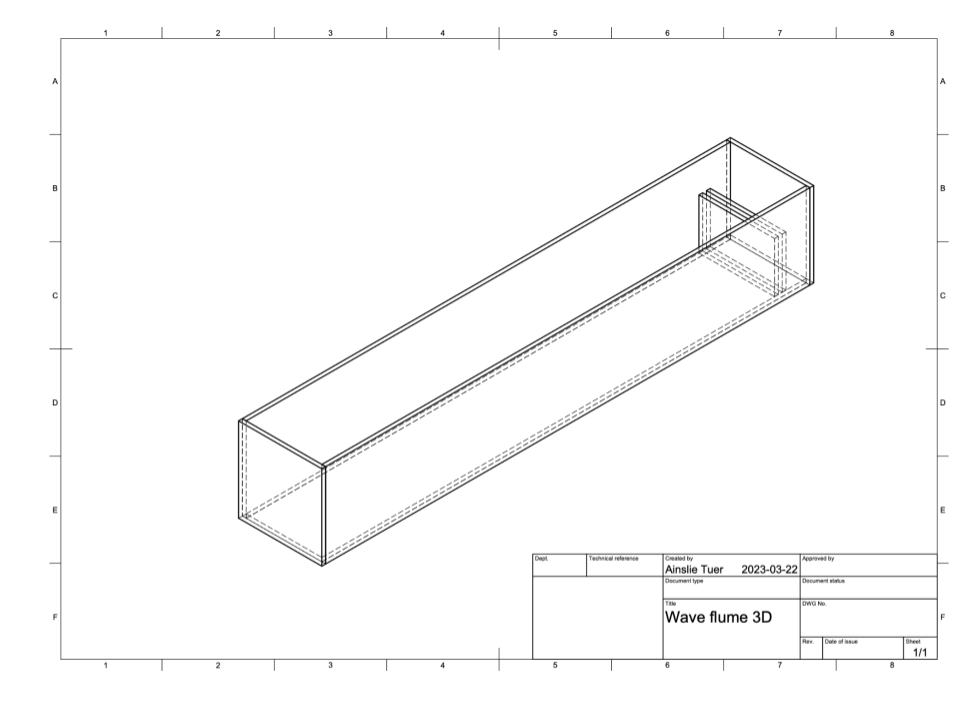
Figure 4. 3D drawing of the constructed wave flume before adding any wave generating components.
To make the height adjusting mechanism for the wave generating flap, the Hanging Alligator Clip by Ostrana on Thingiverse was modified in TinkerCAD (See figure 5). Additionally three other components and four coastal defense mechanisms were designed in TinkerCAD: A gear with an 9.5mm shaft and various holes to change the distance the flap is being pushed (see Figure 6), an attachment to fix a motor with a 50mm x 25mm base to the wall of the wave flume (see Figure 7), an attachment for the flap that allows a wire to connect the gear to the top of the flap (see figure 8), a model to use as a control for the experiment, a vertical seawall model, a reverberated seawall model, and a boardwalk model (See figure 9).. These components were 3D printed using Prusament PLA filament and an Original Prusa i3 MK3S+ printer. The vertical seawall was 25.4mm tall, equating to 1.27m or about four feet tall if it was scaled.
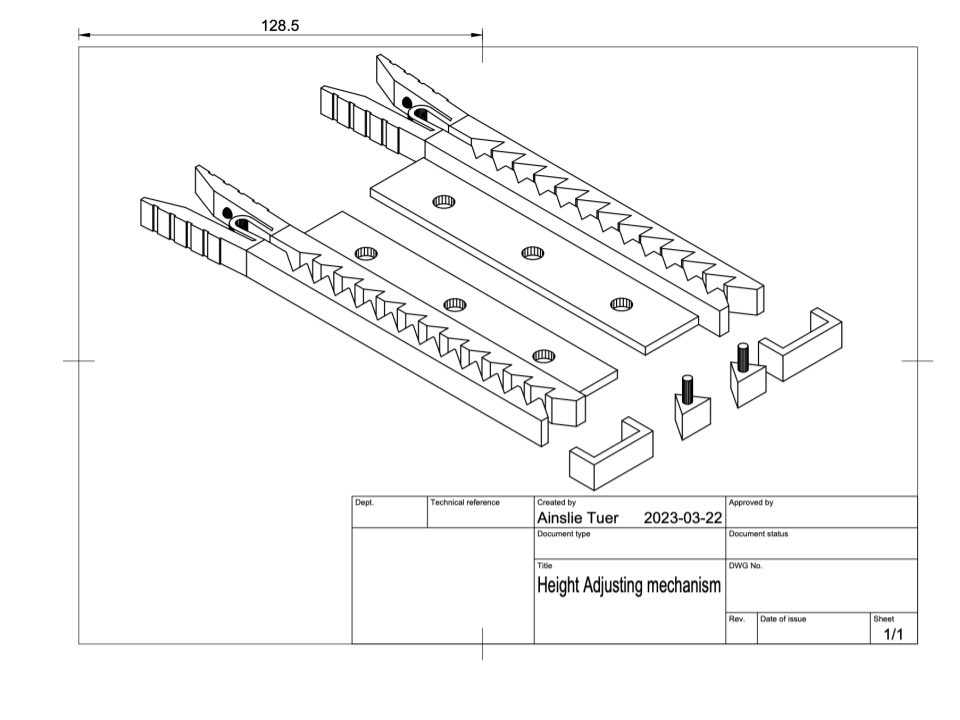
Figure 5. 3D drawing of the height adjusting mechanisms used to hinge the flap to the tank.
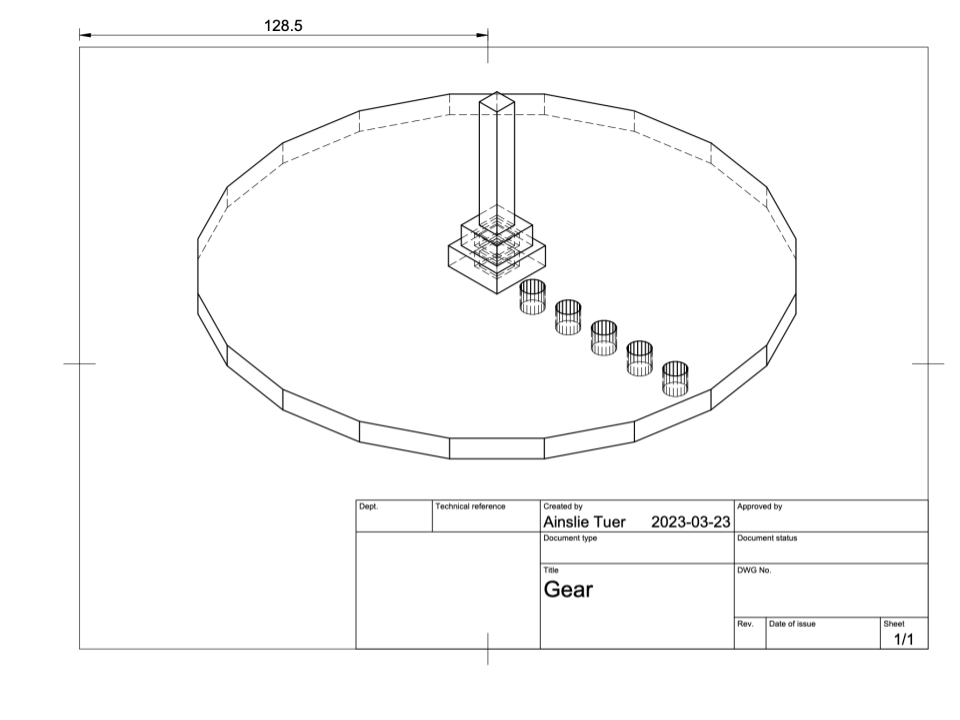
Figure 6. 3D drawing of the gear used to push the flap with holes to adjust the gear radius.
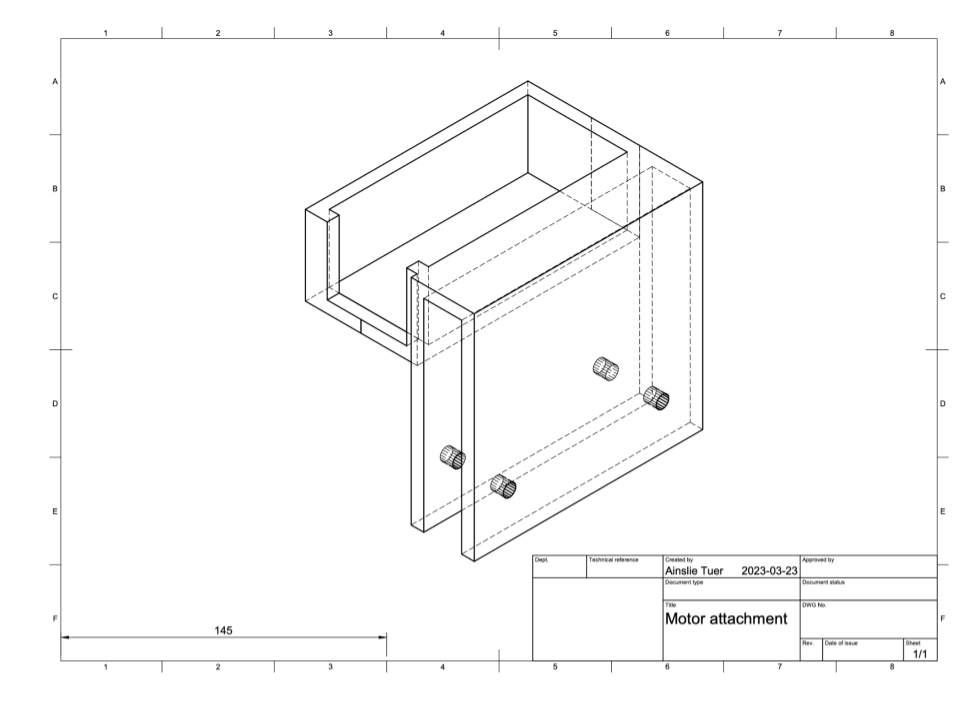
Figure 7. 3D drawing of the attachment used to fix the motor to the wall of the flume.
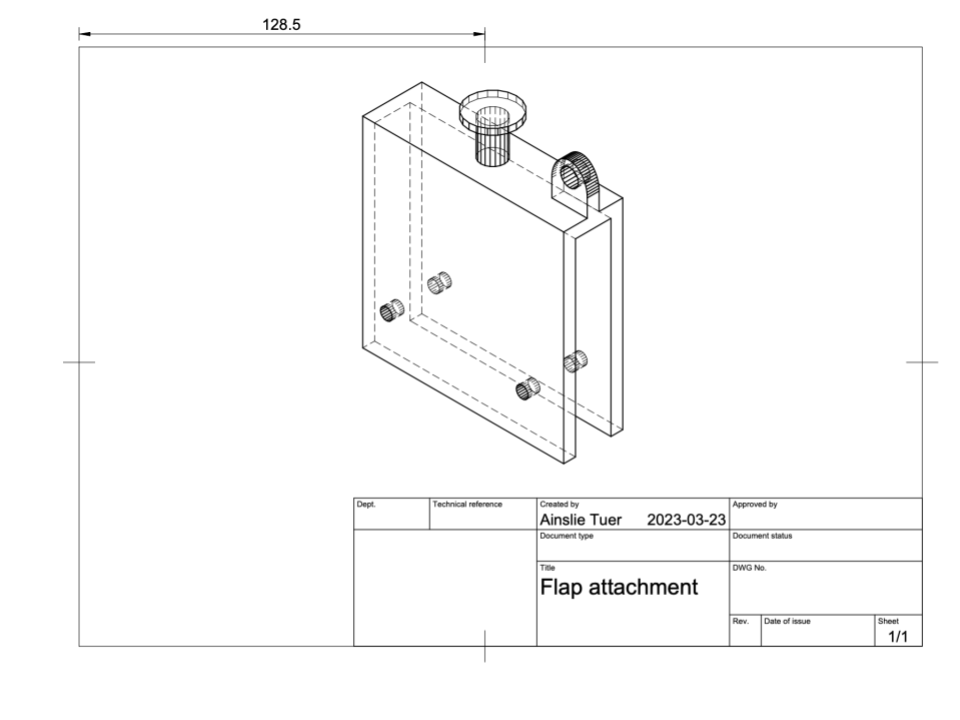
Figure 8. 3D drawing of the attachment used to connect the wire to the flap of the wave flume.
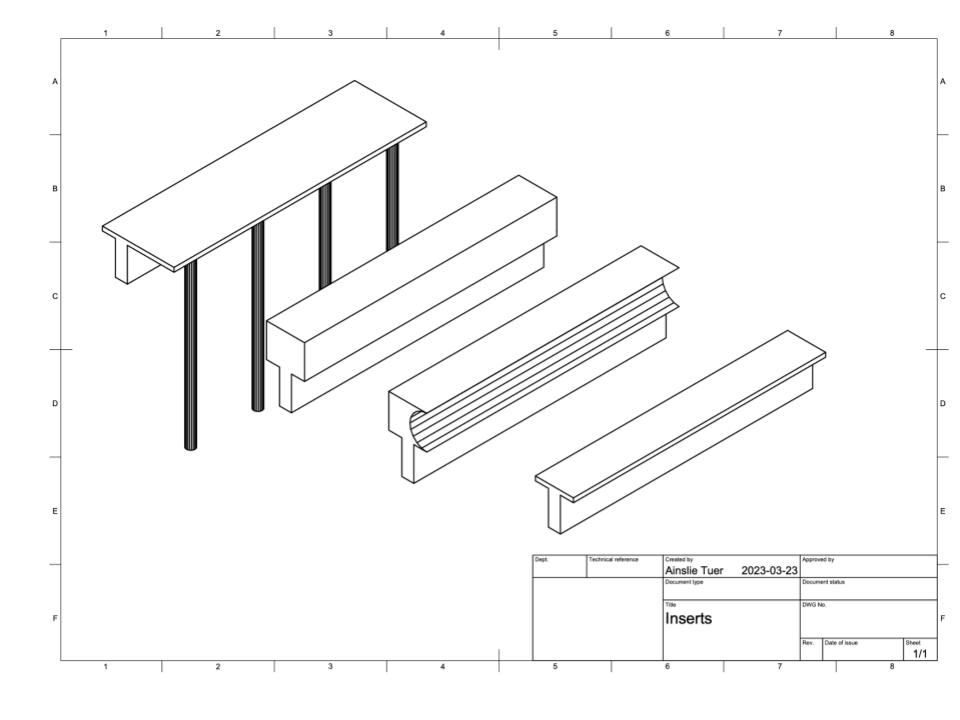
Figure 9. 3D drawing of the boardwalk, vertical wall, reverberated wall, and control models (from left to right).
Each coastal defense model has an extrusion on the bottom surface to fit into the gap in between the 12.7cm plexiglass barriers at the end of the wave flume. The control coastal defense model has a 9.5mm tall cover to cover the barrier. The reverberated seawall was the same height, but with a cutout of a semicircle 25.4mm in diameter at the front. The boardwalk has the same 9.5mm cover as the control model, but it extends 25.4mm in front of the plexiglass barriers. It also has four posts 9.5mm in diameter that extend into the sand. The posts would be 15.87cm in diameter if scaled to the actual value (see figure 9). Before each test, city of vancouver aggregate #17, a sand with a mean sediment diameter of 1.18mm, was sloped into a beach profile with a slope of about 1/2.8 which was the optimum balance between realistically flat and not interfering with the wave making flap.
To generate the waves, a NICE-POWER variable 30 volt, 10 amp DC power supply was used to power a VEX 393 two wire motor by VEX robotics. This allowed the gear to spin at adjustable speeds, which was attached to the top of the flap via a 0.79mm copper wire, moving it back and forth. Video footage of each mechanism test was collected using an iphone. Logger Pro video analysis software was used to collect data about wavelength, amplitude, and period and their photo analysis software was used to measure the volume of water collected past the barrier. After analyzing various motor speeds and gear radii, the power supply was set to a uniform 7.73 volts and the gear radius was set to 12.7mm for testing each method. The time period for each test was 6:00 minutes as after that amount of time the overtopping would overflow the compartment collecting it during the control test.
Data & Analysis
Determining wave parameters
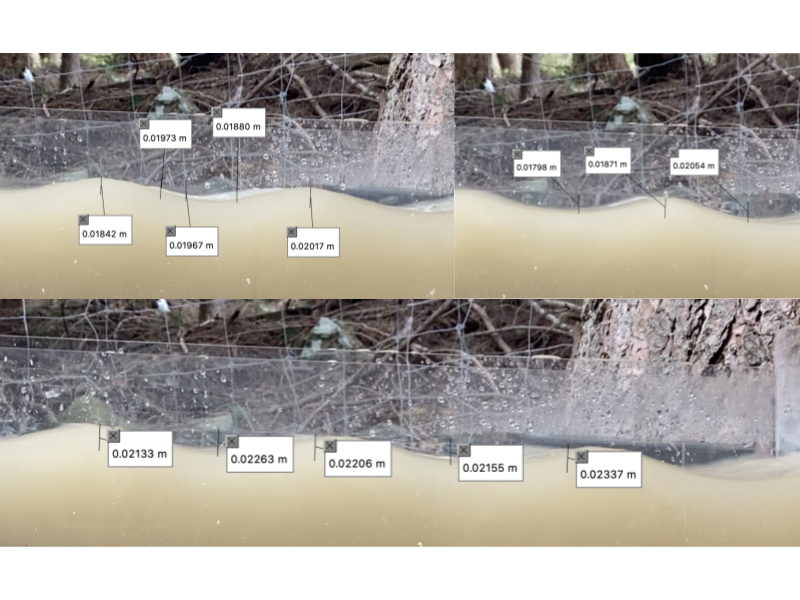
Figure 10. Image showing sample wave heights at random frames during the control test.
When 7.73 volts were input to the motor and the gear was set to a radius of 12.7mm, the mean wave height produced was 0.01896m and the mean amplitude was 0.00948m.
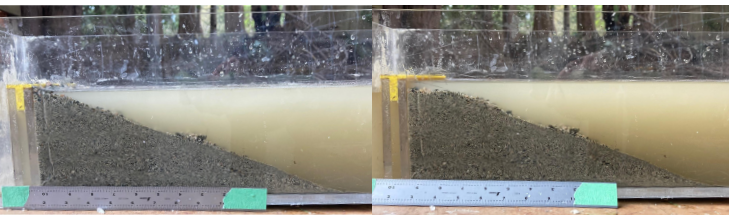
Figure 11. Image showing the beach profile before and after the 6:00 minute test of the control method.
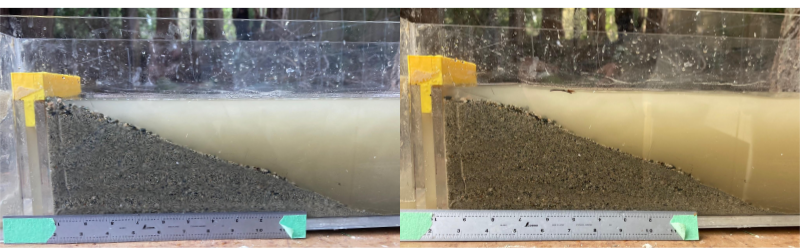
Figure 12. Image showing the beach profile before and after the 6:00 minute test of the vertical seawall.
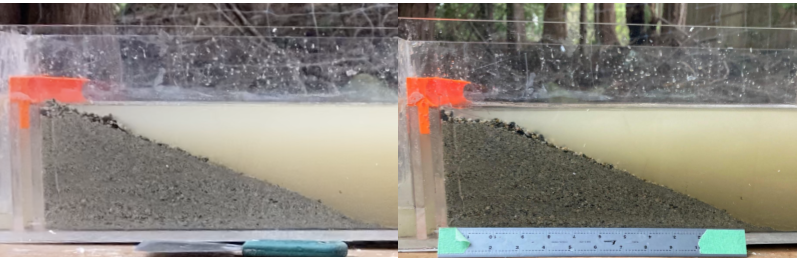
Figure 13. Image showing the beach profile before and after the 6:00 minute test of the reverberated seawall.
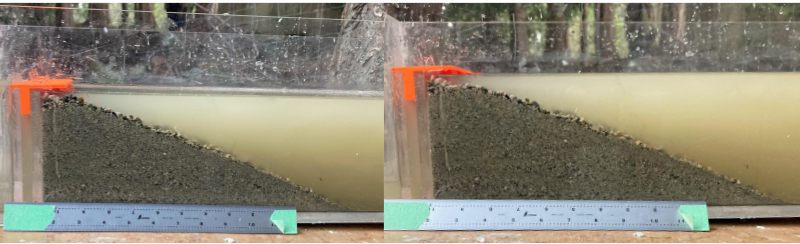
Figure 14. Image showing the beach profile before and after the 6:00 minute test of the boardwalk.
Table 1. Table showing the height of water in the overflow tank before and after each test, as well as the volume collected in mL. Calculated using equation 4, which is equal to the initial volume of water subtracted from the final volume of water, given that the length of the compartment collecting the water is 0.05m and the width of the compartment is 0.1905m, and the m3 is converted to mL. The heights of the water before and after the test was calculated using LoggerPro video analysis software.
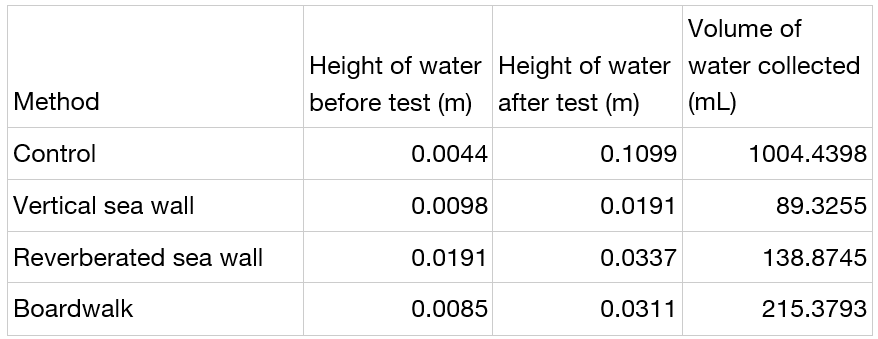
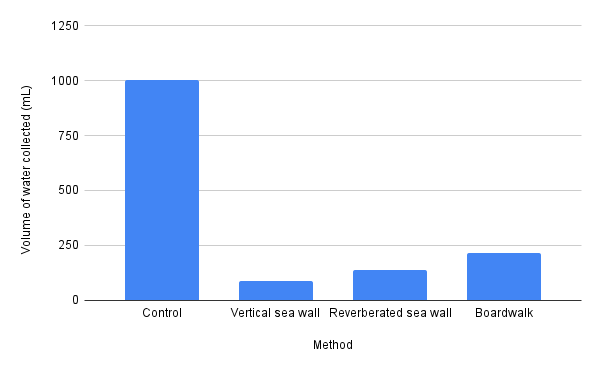
Figure 15. Bar graph showing the volume of water collected in mL after 6:00 minutes for each mechanism.
Discussion
Results
In order to interpret the results it should be noted that the timescale of this experiment is 1:7.07 model:actual value. Therefore the 6:00 minute tests would be about 45 minutes in real time. The boardwalk defense mechanism resulted in the least change in the beach profile, with only a small trough directly in front of the posts attached to the model (see figure 14). The reverberated seawall showed a noticeable trough as well, but the sediment still reached the base of the barrier after 6:00 minutes (see figure 13). The control method and vertical seawall showed roughly equal changes in beach profiles, with the highest sediment about a centimeter below the top of the barrier (see figures 11 & 12).
In terms of flood prevention the control test showed a clear difference from any of the methods, with just over 1000mL collected over the 6:00 minute period. Out of the methods tested, the vertical seawall was the most effective at preventing wave overtopping, collecting only 89mL. The reverberated sea wall was slightly less effective, collecting 139 mL, and the boardwalk collected the most out of the three at 215mL.
Based on this experiment there is no ‘one size fits all’ solution when it comes to coastal defense, and when choosing between the methods it is important to consider the specific needs and uses of the area.
Errors & Improvements
The largest source of error in this experiment was scaling effects. This experiment was scaled using a high prototype to model value, 50:1, meaning many of the results may have been distorted and inaccurate. Five main variables were not scaled: Viscosity, surface tension, density, sediment diameter, and sediment density. Originally the intent of the experiment was to mimic an average local Vancouver beach, but due to experimental constraints with lack of sand and length of the wave flume, the slope of the beach profile was not accurately represented (typically the slope of a local beach is between 1/8 – 1/15 (Matilla, 1988) whereas the slope of the model was 1/2.8).
Conclusion
Overall this experiment showed that the vertical seawall was most effective at preventing flooding, while the boardwalk was most effective at preventing sediment erosion. The right coastal defense mechanism for an area will depend on factors like geology, ecological properties, uses, and community needs. Although this experiment had large sources of error, it coupled with other methods of modeling coastal defense mechanisms provides coastal engineers with valuable insight to various methods of coastal defense. An expansion on this experiment could be creating a larger wave flume with a larger model:prototype value to minimize scaling effects. Computer modeling could also be used to diminish this effect. Studying a wider variety of coastal defense mechanisms such as kelp forests or seagrass beds would also be a valuable extension to this project, as they are harder to model with a computer.
Equations
References
Abroug, Iskander, et al. “Laboratory Study of Non-Linear Wave–Wave Interactions of Extreme Focused Waves in the Nearshore Zone.” Natural Hazards and Earth System Sciences, vol. 20, no. 12, 2020, pp. 3279–3291., https://doi.org/10.5194/nhess-20-3279-2020.
Briggs, Michael J. “Basics of Physical Modeling In Coastal and Hydraulic Engineering.” U.S. Army Corps of Engineers Digital Library, US Army Engineer Research and Development Center, Sept. 2013, https://usace.contentdm.oclc.org/digital/collection/p266001coll1/id/4483/.
Church, John A., and Neil J. White. “Sea-Level Rise from the Late 19th to the Early 21st Century.” Surveys in Geophysics, vol. 32, no. 4-5, 30 Mar. 2011, pp. 585–602., https://doi.org/10.1007/s10712-011-9119-1. Accessed 25 Mar. 2023.
City of Vancouver. “Vancouver’s Changing Shoreline.” City of Vancouver, City of Vancouver, 2018, https://vancouver.ca/files/cov/vancouvers-changing-shoreline.pdf.
“Coastal Defences.” Designing Buildings, 9 Feb. 2022, https://www.designingbuildings.co.uk/wiki/Coastal_defences.
Cuomo, Giovanni, et al. “Scaling Wave Impact Pressures on Vertical Walls.” Coastal Engineering, vol. 57, no. 6, 2010, pp. 604–609., https://doi.org/10.1016/j.coastaleng.2010.01.004.
Environmental Reporting BC. “Climate Change.” Sea Level – Environmental Reporting BC, Province of British Columbia, 30 Dec. 2016, http://www.env.gov.bc.ca/soe/indicators/climate-change/sea-level.html.
Heller, Valentin. “Scale Effects in Physical Hydraulic Engineering Models.” Journal of Hydraulic Research, vol. 49, no. 3, 2011, pp. 293–306., https://doi.org/10.1080/00221686.2011.578914.
Hughes, Steven A. “Physical Models and Laboratory Techniques in Coastal Engineering.” Advanced Series on Ocean Engineering, 1993, https://doi.org/10.1142/2154.
Mattila, Mark Ronald. “Beach Profiles and Sediment Activity.” University of British Columbia, University of British Columbia, 1988.
Narayan, Siddharth, et al. “The Effectiveness, Costs and Coastal Protection Benefits of Natural and Nature-Based Defences.” PLOS ONE, vol. 11, no. 5, 2016, https://doi.org/10.1371/journal.pone.0154735.
“Second International Conference on the Application of Physical Modelling to Port and Coastal Protection.” On the Scaling of Sediment Transport in the Nearshore, https://www.researchgate.net/publication/41599690_On_the_scaling_of_sediment_transport_in_the_nearshore. Accessed 25 Mar. 2023.
Smit, Pieter, et al. “Depth-Induced Wave Breaking in a Non-Hydrostatic, near-Shore Wave Model.” Coastal Engineering, vol. 76, 2013, pp. 1–16., https://doi.org/10.1016/j.coastaleng.2013.01.008.
Stive, M.J.F. “A Scale Comparison of Waves Breaking on a Beach.” Coastal Engineering, vol. 9, no. 2, 1985, pp. 151–158., https://doi.org/10.1016/0378-3839(85)90003-1.
Sukhinov, A. I., et al. “Mathematical Model for Calculating Coastal Wave Processes.” Mathematical Models and Computer Simulations, vol. 5, no. 2, 2013, pp. 122–129., https://doi.org/10.1134/s2070048213020087.
Young, Donald F. A Brief Introduction to Fluid Mechanics. Wiley, 2011.