Kevin Ma, Applied Science
Abstract
This experiment aims to tackle the underlying mess with aquarium water changes. Using two peristaltic pumps, an aquarium pump, and an Arduino, a system was created to dose and mix an API liquid test kit. A manual test was run alongside the machine and the results were compared with each other at the end. The results from the machine differed from the manual test quite drastically with one trial having a significantly lighter colour when compared with the manual results. This could indicate a problem with the ratio and volume of the solutions, underdosage and overdosage from the pumps, and a problem with the mixing mechanism. Though the system did not accurately measure the amount of nitrates present in the aquarium, it displays that such a system is viable with liquid test kits.
Introduction
Whether it is a scientist meticulously testing water parameters or an aquarist measuring the nitrate levels in their fish tank, manually conducting water tests always leads to a messy and arduous process. For many aquarists, the thought of a mess is enough to cause them to avoid it. Though a nitrate test may seem unnecessary, it can be the determining factor to whether an aquarium thrives or dies. Without regular water parameter tests, an aquarist will be uninformed to any spikes that occur, which can leave an aquarium in ruins. It is no surprise that attempts to automate the process have been made. Scientists have created systems based around this premise, automating aquarium care and even drinking water tests (Brandl and Kellner 2022). With a combination of qualities from different studies, a system to measure nitrate in aquariums was created. With this design the goal is to reduce the hassle and mess that is associated with water testing and make the process simpler and easier to incentivise people to perform tests on a regular basis.
There are a couple different studies ranging from automatic nitrate and nitrite rapid tests to automated aquarium care. Together, scientists, Brandl and Kellner (2022) designed a system, revolving around Quantofix nitrate and nitrite test strips, that can automatically run bi-weelky rapid tests for drinking water. In addition, their system is effective and meets the European Drinking Water Directive requirements. On the aquarium side, Siregar et al. (2019) have already experimented with an automated aquarium concept. Using different sensors, an arduino, and a cloud server, data is collected on the aquarium and relayed to the user. The aquarium was equipped with a water level, pH, conductivity, and temperature sensor alongside an automatic heater and feeder. Values taken from these sensors by an arduino were forwarded to a cloud server where the data can be viewed from a website (Siregar et al. 2019). A similar experiment was done by another group of scientists, Dinesh et al (2022), utilising ultrasonic and temperature sensors to monitor the water level and temperature. An automatic feeder and app was created alongside to automate the feeding process and to notify the user. Many of these experiments monitored the pH and temperature of the water, but not the ammonia, nitrite, and nitrate levels.
From the sources above, there are two methods prove to be points of interest, test strips and sensors. The system used to analyse drinking water uses a method of which a test strip containing two test pads, one for nitrite and the other for nitrate, is loaded into a chamber where roughly 67 microlitres of sample water is dropped onto each pad (Brandl and Kellner 2022). A white led then illuminates the pads and a RGB sensor records the red to green ratio and compares it to a control to determine the content of each chemical. The test strips rely on the Griess test to detect both nitrite and nitrate. The scientists also included how they overcame the challenges in the process. For instance, the test strips were sensitive to moisture resulting in silica gel being placed in the sensor chamber (Brandl and Kellner 2022).
The other sources cited all revolved around using sensors to monitor different aquarium parameters, using an Arduino to collect and send the data to a server where it can be monitored. Though the basis is similar, these experiments differentiate themselves by testing for different parameters. While one experiment measured the water level and temperature (Dinesh et al. 2022), another group focused on the more technical aspect and tested the pH and humidity (Shamshulbahrin and Ahmad 2019). In the lab done by Shamshulbahrin and Ahmad (2019), alongside sensors put to monitor water level, pH, and temperature, systems were implemented to balance any changes. If the water temperature rose above a threshold, colder water would be pumped in to cool it down. In addition to water pH, temperature, and automated feeding, the group measured the conductivity of the water to determine the number of ions. A website featuring a detailed graph was included as well.
Connecting back to this project, an automatic nitrate tester for an aquarium, these sources all share aspects with my design. The study from Brandl and Kellner (2022) has a focus on nitrite and nitrate testing, utilising lab grade equipment to achieve their results. Test strips are used alongside a colour sensor to record and measure the nitrite and nitrate levels. The design used in this project drew inspiration from this, using a colour sensor to measure the parameters, though instead of test strips, a liquid test for nitrate is used. The other labs and studies done on automated aquarium care mostly contain the same methodology. Sensors placed in the aquarium are connected to an Arduino, which in turn collects data and presents it to the user on a website or app (Shamshulbahrin and Ahmad. 2019) (Dinesh et al. 2022) (Siregar et al. 2019). The design used in this project shares similar qualities, using a pump, arduino, and colour sensor to take and record samples. Pairing these qualities with the study done by Brandl and Kellner (2022), my design is a mix of the rapid tests and automated aquarium tests remedying the absence of an automated nitrate test for aquariums.
All of the studies successfully alleviated the issues associated with water parameter testing or aquarium care. The work done in this field is already quite sufficient with a wide variety of content ranging from drinking water tests to automated aquarium care. Taking traits from all the studies, a system to automatically test aquarium water for nitrate was created. Using an API nitrate test, a colour sensor, an Arduino, and a pump, the nitrate content of the aquarium water can be measured.
Though this topic is sufficiently covered with a variety of different studies and perspectives, I hope to contribute with my aquarium nitrate test design.
Materials and Methods
The entire machine was constructed using readily available electronics, household items, and 3D printed components. In order to properly dispense the proper amount of water and reactants, two Gikfun 12V peristaltic motors were used alongside 4mm OD, 2mm ID silicone tubing for dosing the two reactants of the nitrate test kit and a 9V aquarium pump, overvolted to 12V, with roughly 30 cm of tubing was used to dose 5mL of water. For the mixing mechanism, an additional 12V motor was used alongside a 39:15 gear system to rotate the mixing vial. These motors and pumps were powered using a twelve volt battery pack that was connected to PWM capable MOSFETs controlled by an Arduino Uno. The whole assembly is then screwed to a 3D printed frame and screwed to a base. The box of the Arduino Uno is then glued on and used as a support. Before any testing begins, the 9V pump needs to be calibrated to dispense 5mL. Using Arduino IDE 2.0, set the pin that corresponds to the MOSFET controlling the pump to “HIGH” and follow with a delay of 2000ms before setting the pin to “LOW”. Measure the amount of liquid output and adjust the delay by -100 or +100 accordingly. Once the pump is tuned, take note of the delay. Using Arduino IDE 2.0, set the pin corresponding to one of the two peristaltic pumps to “HIGH” and set the delay to 30000 ms before setting the pin to “LOW”. Repeat for the other peristaltic pump. Lastly set the pin corresponding to the spinner motor to “HIGH” with a delay of 60000 ms before setting the pin to “LOW”. For testing, there are two portions, the machine test and a manual test. For the machine test, prepare a 750mL beaker with 200mL of aquarium water. Put ten drops of solution #1 of the nitrate test kit into one of the glass jars. Shake the solution #2 bottle for 30 seconds and put ten drops into the other glass jar. Turn on the Arduino and start the code. Wait for solution #2 to start pumping.
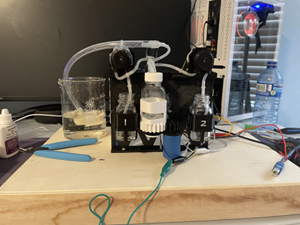
Figure 1. The system fully assembled
While the machine is pumping the reactants, add 5mL of the same aquarium water into the test tube included with the kit. Add 10 drops of both reactants and wait. When the machine starts to spin the mixture, start vigorously shaking the test tube until the spinning stops. When the machine stops spinning, place the test tube down and start a timer for five minutes. When the timer finishes, compare the test tube and machine results with the colour sheet provided with the test kit and take pictures and results.
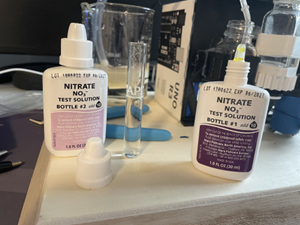
Figure 2. Solutions 1 and 2 alongside a 5ml test tube
Initially a colour sensor was to be used to read the RGB values of the samples and compare them to the card but due to a lack of time and experience, the colour sensor was integrated but never used.
Results
While the machine was able to dispense and mix water and reactants, it failed to do so both precisely and accurately, resulting in varied results. The colour reference sheet used was for a saltwater tank, resulting in the ppm measurements being wrong. This error does not affect the results much as the consistency of colours between trials is the focus. With the first trial, both results shared a similar colour. With the second sample, the machine sample had a darker hue leaning towards 4 ppm when compared to the manual sample which had a lighter colour. The third trial differed drastically with the manual sample being considerably darker, having a reading of roughly 10 ppm, and the machine sample having a reading of roughly 4 ppm. The peristaltic pumps were intended to accurately dose each solution whilst drawing from a bottle of reactant but due to concerns about time and longevity, ten drops were put in each jar at a time and the pumps were set to run for 30 seconds each. The results from the machine always read less nitrate when compared to the manual tests.
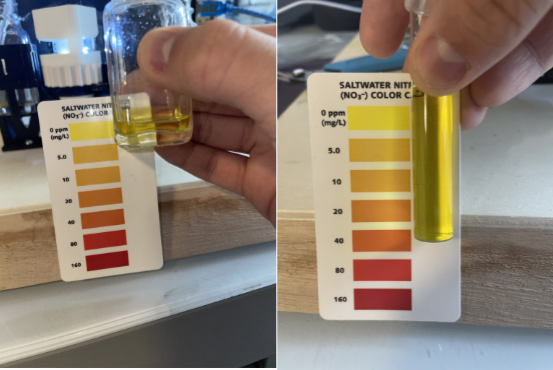
Figure 3. Results of the first trial, note the lacklustre amount of water
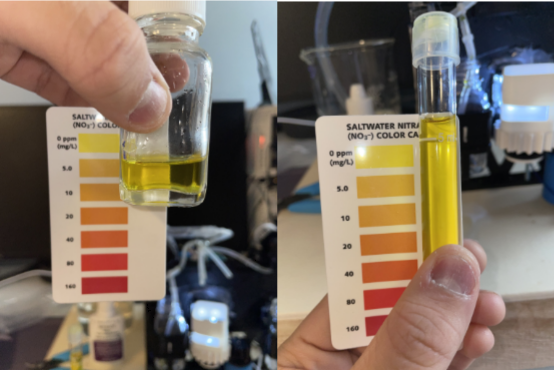
Figure 4. Results of the second trial
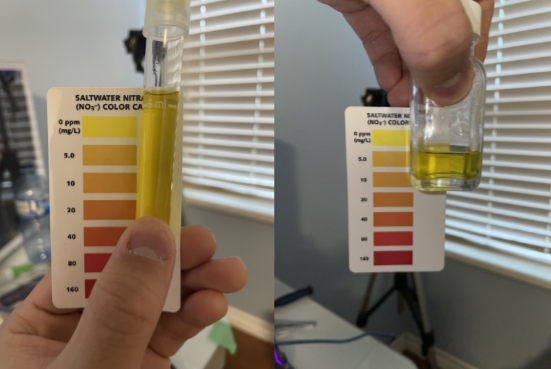
Figure 5. Results of the third trial
Discussion
Though the machine was able to dose, mix, and test for nitrates using the API Nitrate Test, the results differed drastically from a manual test, with parameters 5-10 ppm off at times. Despite the usage of the wrong reference sheet, the consistency of the colours is still able to be determined. The manual tests all had similar results while the machine tests had results with parameters 5-10 ppm off at times. These differences could have been caused by many factors. The peristaltic pumps did not completely dose the ten drops of each solution as it stuck to the walls of the tubing. Paired alongside the 9V pump, it did not pump exactly 5mL of water every trial. These two factors combined could have caused the readings to be inaccurate as the solutions are not dosed at the recommended concentrations stated in the kit. The mixing mechanism used by the machine was in the form of a spinner while the mixing method recommended by the kit is a shaking motion. This could have caused the solutions to mix inadequately due to a lack of aeration. The small glass jar used in the machine was significantly larger when compared to the test tube included in the kit. This could have affected the colouration as the liquid spread out more in the jar compared to the test tube. Despite these shortcomings, the machine did its intended task of dosing and mixing solutions to test for nitrate. These tests indicate that automated nitrate testing is a possibility, which, if developed, can serve a larger role in encouraging new aquarists to test water regularly. In the future a proper mechanism for shaking and dosing could be explored to improve accuracy. With more time and resources given, better dosing pumps, a redesigned mixing mechanism, and a similar test tube could improve the results drastically. Alongside a better dosing and mixing system, utilizing the integrated colour sensor would likely improve the accuracy of the colour readings and tests.
References
Brandl, M., and K. Kellner. “Automatic Measurement System for Nitrite and Nitrate in Water Bodies.” IEEE Sensors Journal, vol. 22, no. 14, 15 July 2022, pp. 14531–14539., https://doi.org/10.1109/jsen.2022.3182785.
Dinesh, K., et al. “A Review of Literature on the Performance Appraisal of the … – IRJMETS.” Irjmets.com, International Research Journal of Modernization in Engineering Technology and Science, Mar. 2022, https://www.irjmets.com/uploadedfiles/paper/issue_3_march_2022/19937/final/fin_irjmets1647667857.pdf.
Shamshulba, Aman Shakirin, and Izanoordina Ahmad. “Aquarium Monitoring System via .” Universiti Kuala Lumpur British Malaysian Institute, 18 Jan. 2019.
Siregar, B, et al. “IOPscience.” Journal of Physics: Conference Series, IOP Publishing, 1 Aug. 2019, https://iopscience.iop.org/article/10.1088/1742-6596/1255/1/012036.