Alex Qin, Applied Science
Abstract
Drawing is not something that everyone likes and excel at it, as the lines that make up pictures are sometimes very hard to draw it straight. This could be extra problematic when drawing then electronically. This project investigates a way that to fix that problem by making a program that will refine the lines of the drawings by the use of a math equation, and using the approximation that the math equation gives about the drawing.
Introduction
According to statistics, around 99.9% of people know how to draw to a certain level (Yourartpath 2023). However, that doesn’t mean everyone is a good artist. For some people drawing could be their worst nightmare, where every time they draw it is very hard to get the lines strait and maybe even have to repeat lots of times. Especially during the era of the computers, where it is sometimes more convenient to draw on a screen, even with the right tools, drawing those lines strait might be a difficult and annoying task. By creating something that can read and modify drawings would simply take loads off the people that do not like to draw or do not like to draw.
This project will aim to create a program that will be able to take in drawings from the user and return a modified drawing with a much smoother edge. As computers are very mathematical tools, modifying images will be quite complicated. To do that, we will have to look at something called the Fourier Series. The general idea behind Fourier Series is to express any periodic functions in terms of a combination of sine or cosine waves. Theoretically, any kind of these functions can be expressed by the series if we have enough terms (Wolfram Math World). The Fourier Series have a very wide range of uses, including the Fourier transform, Quantum Fourier transform, Fourier series itself, etc.(3Blue1Brown 2019). However, the only one that will be used here will be the complex Fourier series.
The property of the complex Fourier series that makes it better that the regular Fourier series will be that it has complex outputs, in other words, outputs of two dimensions. The real part which represents is one dimension, the imaginary part which represents another dimension. Therefore, any 2-dimensional drawings can be represented by such series, as long as we have enough terms in the series. This means the more terms in the series and more data points in the image will result in a better approximation of the original. Taking advantage of the fact the smoothness of mathematical functions, we can take the approximation of the original image as the output we want.
Each term in the series will be a vector, in this case, a complex number, rotating at the rate of the term number. Where the nth term will be rotating at n revolutions per second. In mathematical terms, we can define the complex series as , thus:

In the equation, the variable “t” represents time, where for any positive real number, the output will be the sum of the vectors will be pointing at, at the specific time “t”. The “n” represents the term number, but it also dictates the rate at which the vector will be rotating at (The exponent multiplied by n). The “c” in the equation is a constant complex number that controls how long and where the vector starts from.
Below will be how the constant tern “c” will be computed:

The “n” represents the nth term number of the series, “t” represents the time as it ranges from zero to one. The function f of t outputs a complex number pointing to the position of the image at the specific time. To explain the equation in simple terms, it is basically taking an average of all the points in the image and sum them up as “t” changes.
From the previous two equations, one of which has a sum of infinite terms, the other one is an integral from zero to one, which are both are impossible to compute. However, that is only needed if we are computing the exact same image as inputted, which is unnecessary because we only want the approximation of the original. In this case, we can control the number of terms “n” from the first equation, and delta “t” in the second equation.
Materials and Methods
For the computer to read the path of the image efficiently, a Scalable Vector Graphics (SVG) converter from Adobe is used. As for the program itself, the reading and the output will be done with the programming language python as it has easily accessible libraries, installed by the package manager “pip”.
To read the svg files, the package “xml.dom” is used to open up the svg file itself. In order to obtain data points from the file, another package “svg.path” is used to take data points from the file, and these data points are then stored in an array and this array will be the in the formula. As for the number of data points taken, this can be controlled by the user depending on the accuracy that is wanted to get the approximation. To drawing of the image, the library “Pillow” along with packages in the library “Image” and “ImageDraw” is used to draw on any blank image file on the computer with the output values by the Fourier series. Below shows an image of the code used to compute the drawing:
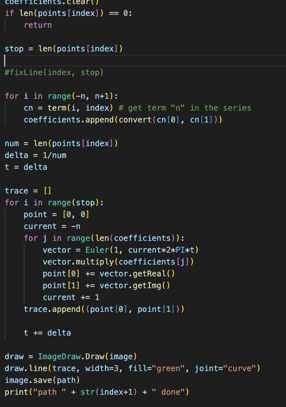
Figure 1. Displays the main code segment that computes the drawing with the use of different classes.
A random badly drawn image will be used to test the functionality of the program, and we will be comparing the different approximations that the program outputs. The density of the point taking will be set to 2, in other words, for whatever length that the svg path has, twice the number of points will be taken. Below is the image that is found online which is going to be used for testing:
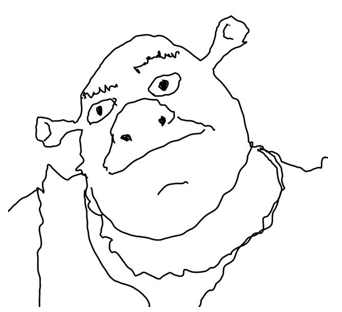
Figure 2. A badly drawn image taken for website BuzzFeed, that is used as the input of the program.
Results
In this test, 4 sample outputs are tested with different number of vectors. The number vectors are chosen by the amount that best demonstrate the process of the program approximating the original image.
Below shows the different variations of the output as the number of the vectors increases. Where every output is drawn by the program on to a blank file, and each file type will be a “png” type file despite the input as a svg file.
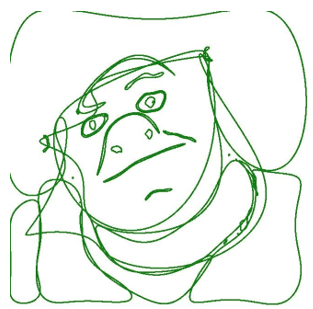
Figure 3. The first output done made by the program made with 11 vectors, each vector ranges from term number -5 to 5.
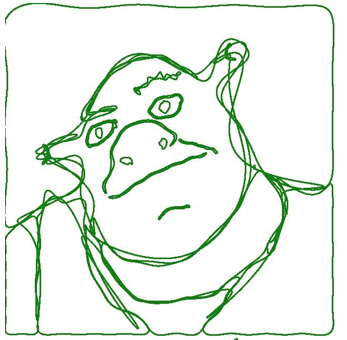
Figure 4. The second output made by the program with 31 vectors, each vector ranges from term number -15 to 15.
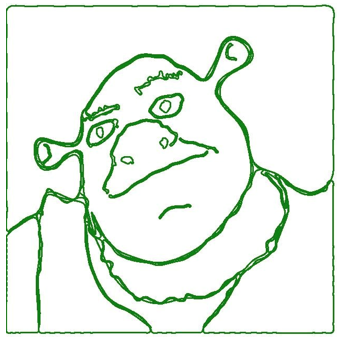
Figure 5. The third output made by the program with 101 vectors, each vector ranges from term number -50 to 50.
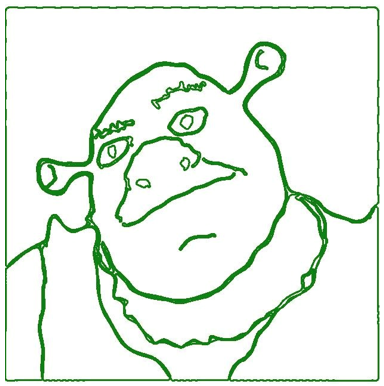
Figure 6. The final output that is made by the program with 191 vectors, each vector ranges from the term number -95 to 95.
Discussion
As shown in Fig. 3-6, the output files made by the program will look more like the original image as the number of vectors used increases. Arguably, the output made by the computer in Fig. 6 is a lot better than the original image, as the lines are a lot smoother when you compare, for example, the outlining of the ear, clothing, etc. Therefore, it does seem like that the program does have the ability to smooth out the edges and make improvements on the original drawing.
The drawing that is made in Fig. 2 might not seem like the product of someone drawing with the best of their abilities for most people, and that might be right. However, that might not be the case when drawing electronically, especially when using a mouse or drawing on a tablet without the proper tools. In that case, the program will make a significant difference in making the line on point. This project itself do focuses more on drawings that are done electronically, but it could also be applied to physical drawings too. All the materials needed to accomplish that is to use a printer, then scan the drawing and download it as a png file. This way the drawing will be modifiable by the program, and the output can be printed by the printer.
One thing to note is that this program will only limit the input to line drawings, this has to do with the actual method in computing this drawing. Even though svgs do tend to allow colours to be implemented and the complex Fourier series do have outputs of two dimensional, but since colors do not follow any specific path as lines do, and it just fills the area that is made, therefore the complex Fourier series will not be able to handle it.
Another thing that can be seen clearly especially in Fig. 5 and Fig.6 is that there are white spots present in between the lines, this shows that there are multiple small lines that is making up the lines (can also be seen in Fig. 4). This is not a feature of the what the output should be, but it is not the problem with the method used computing the drawing. The reason lies during the use of the svg converter when changing png file to svg files. Since the structures of the png files only uses pixels to display the lines, thus it is impossible to have lines that have width of one pixel. Therefore, when converting it to a svg file that defines the lines in terms of mathematical curves, it will have two lines displaying the edges of the line. Since the process of this project did not focus on making a svg converter as it is a bit more complicated. The next step that project can take will be to make a svg converter that is more specific to this project alone.
References
Engvalson, Audrey. “I Drew These Iconic Movie Characters with My Left Hand — Can You Guess Them?” BuzzFeed, 5 Oct. 2020, www.buzzfeed.com/audreyworboys/badly-drawn-movie-character-quiz. Accessed 27 Mar. 2023.
Mike. “Drawing Shapes on Images with Python and Pillow.” Mouse vs Python, 23 Feb. 2021, www.blog.pythonlibrary.org/2021/02/23/drawing-shapes-on-images-with-python-and-pillow/#:~:text=Here%20you%20open%20up%20the. Accessed 27 Mar. 2023.
Sanderson, Grant. “3Blue1Brown – but What Is a Fourier Series? From Heat Flow to Circle Drawings.” Www.3blue1brown.com, 29 June 2019, www.3blue1brown.com/lessons/fourier-series.
Weisstein, Eric W. “Fourier Series.” Wolfram MathWorld, 2022, mathworld.wolfram.com/FourierSeries.html.
“What Percentage % of the Population Can Draw?” Yourartpath.com, 2023, yourartpath.com/what-percentage-of-population-can-draw#:~:text=99.99%25%20of%20the%20population%20can.