Emily Pan, Life Science
Abstract
With the increased use of antibiotics, antibiotic resistance is becoming continually more wide-spread, leading to more than 2.8 million resistant infections per year. This project investigated the effect of pH on antibiotic resistance of E. coli K-12 against Neomycin, a common antibiotic used for intestinal infections and as a preoperative antibiotic to prevent postoperative infections. E. coli was treated with Neomycin disks dipped in various pH, ranging from pH 5 to pH 9. It was determined that pH 7 is the most effective, followed by pH 6. Statistical tests were conducted to determine the significance of differences between treatments. This study suggested that Neomycin performs best in pH 7 against E. coli, and that the effect of pH should be taken into account in administering antibiotics to optimize antibiotic usage in medical settings, which, in turn, could help slow down the progression of antibiotic resistance.
Introduction
Since the antibiotic Penicillin was first discovered, antibiotics were prescribed, though often unnecessary since they were prescribed for respiratory conditions caused by viruses (CDC, 2016). This over prescription of antibiotics (Cronan, 2019), coupled with fast cycles of bacterial evolution that enable quick acquisition of resistant genes (“What Is Antibiotic”), have led to bacterial infections being increasingly difficult to treat. More than 2.8 million resistant infections occur each year (CDC, 2021). Thus, antibiotic resistance is a focus of future studies.
According to previous research, many gram-negative bacteria are susceptible to antibiotics when they are grown at different pH and phenotypic states (Thomas et al., 2011). As E. coli are gram-negative bacteria, they are likely to exhibit different growth in the presence of antibiotics at different pH. Another study has presented the correlation between oxygen concentration, pH and Neomycin (Williams, 1971), indicating that pH could possibly have an effect on antibiotic resistance led by Neomycin. Past research conducted on different antibiotics, such as a research study that examined the relationship between antibiotic susceptibility of uropathogenic bacteria and pH, found that ampicillin demonstrated most active antibacterial activity at pH 5 to 7 while gentamicin was the most potent at alkaline pH in all of the strains tested (Kincses et al., 2021). This implies that whether an antibiotic better inhibits bacterial growth at acidic, neutral or alkaline pH depends on the antibiotic in question. Research for independent antibiotics and strains of bacteria is needed to understand the correlation between differing pH and antibiotic resistance as no general correlation can be drawn.
E. coli are rod-shaped, gram-negative bacteria that have been known to have caused numerous infections across several organ systems (Percival, 2014). According to previous research, less than 15% of E. coli isolates are resistant towards Neomycin (Moennighoff, 2020), which made it ideal to model E. coli’s antibiotic resistance against Neomycin in this experiment. Neomycin is commonly used to treat intestinal infections and hepatic coma (“Neomycin”), which is a nervous system disorder that is caused by severe liver disease, in addition to being used as a preoperative antibiotic to prevent postoperative infections (Veirup and Kyriakopoulos, 2022). Neomycin impedes E. coli growth by binding to the 30s ribosomal subunit which interferes with bacterial protein synthesis, specifically the elongation of protein during translation (Veirup and Kyriakopoulos, 2022). Due to the infections E. coli can cause and the wide range of treatments Neomycin provides across different pH, E. coli’s resistance towards Neomycin provides an ideal model to test the effect of pH on antibiotic resistance.
This experiment studies the effect of pH on the antibiotic resistance of E. coli against Neomycin with a goal of possibly enabling the optimization of antibiotics to potentially slow down the progression of antibiotic resistance towards Neomycin as well as further the understanding of the possible effects of pH on antibiotic resistance across different pH, which can inform future usage of Neomycin and other antibiotics.
Materials and Methods
In preparation for the experiment, petri dishes were used with LB agar as the medium. E. coli K-12 (Merlan Scientific) was streaked using a cotton swab onto one petri dish using the quadrant streaking method to reproduce a new generation of bacteria and produce separate E. coli colonies for the experiment. The petri dish was incubated at 25 °C for 7 days.
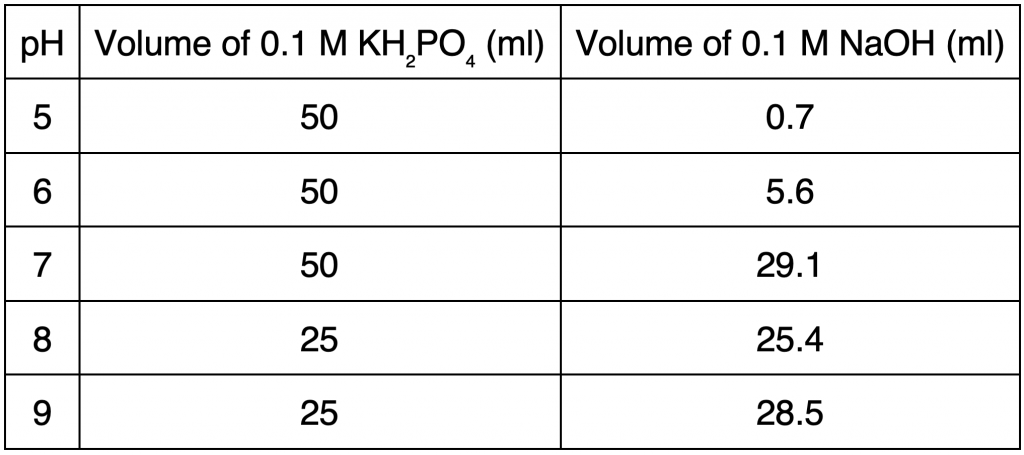
To obtain solutions of different pH, phosphate buffers of pH 5, 6, 7, 8, and 9 were made using NaOH and KH₂PO₄ (“Preparation of pH buffer”). 0.1 M KH₂PO₄ was made by mixing 1.36 g of KH₂PO₄ per 100 ml of solution with distilled water. 0.1 M NaOH was made by mixing 1 g of NaOH per 250 ml of NaOH solution with distilled water. Different volumes of 0.1 M KH₂PO₄ and 0.1 M NaOH, as shown in Table 1, were mixed to obtain pH 5, 6, 7, 8 and 9.
Table 1. Proportions of 0.1 M KH₂PO₄ and 0.1 M NaOH for pH 5, 6, 7, 8, and 9.
To proceed with the experiment, bacterial suspension was made by picking up 2 colonies of E. coli that were 6 mm in diameter with a cotton swab and swirling the swab in 2 ml of distilled water in a 5 ml test tube until the solution became cloudy. The bacterial suspension was made twice. Then, 200 μl of the bacterial suspension was pipetted into each of the 15 petri dishes for experimentation. Three petri dishes were used for the three trials of each pH.
Each petri dish was divided into four quadrants (Figure 1). The top left quadrant contained the negative control for each pH. The negative control was made with a sterile blank disk dipped in distilled water. The top right quadrant contained a blank disk dipped in the buffer corresponding to the pH tested in the plate. The positive control was placed in the bottom left quadrant, with only a Neomycin disk (Merlan Scientific). The bottom right quadrant contained a Neomycin disk dipped in a specific pH buffer for 20 seconds. The four quadrants were designed this way to assess the effect of pH on bacterial population as well as the combined effect of pH and antibiotic resistance for E. coli, with a negative and a positive control to ensure the experiment was done properly. After the four disks were placed for each petri dish, the 15 petri dishes were placed with the lid up to dry for 20 minutes, then were placed upside down to incubate at 25 °C for three days.
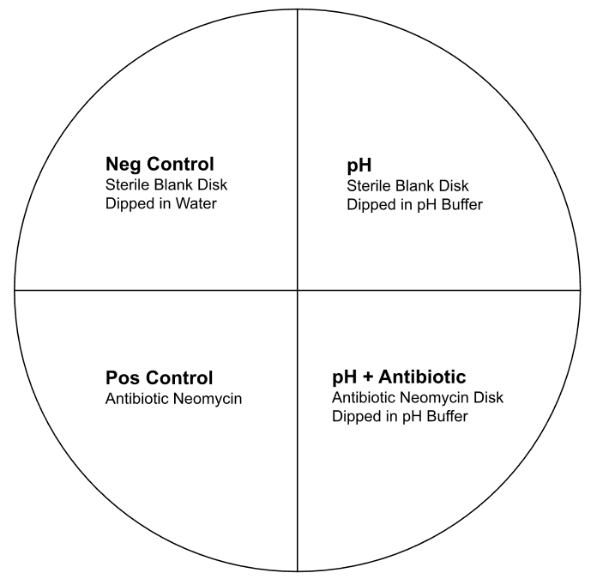
Figure 1. Petri dish set-up with four quadrants each containing a control or treatment.
After three days, the diameters of the zones of inhibition were measured. To increase the accuracy of the measurements, a photo of all petri dishes was taken then uploaded onto ImageJ to be measured using computerized tools. The measurements were used to calculate ratios and percent changes of the diameters of the different zones of inhibition.
Statistical Testing
To determine the statistical significance of the effects of different pH on the percent changes of diameters of zones of inhibition, One-Way Analysis of Variance, which determines if population means are significantly different, was conducted. The programming language R was used to conduct the statistical tests (Appendix A).
First, a data frame was created with the data obtained from computerized measurements. Then Bartlett’s test was conducted to determine the homogeneity of variances (Glen). The purpose of Bartlett’s test was to determine whether regular one-way ANOVA or Welch’s ANOVA should be conducted (Glen). The distinction between the two tests is that the classic one-way ANOVA assumes equal population variances while Welch’s ANOVA does not (Frost). The null hypothesis of this test was that the population variances were equal while the alternate hypothesis was that at least two variances were different (“Are the Means Equal”). A significance level of 0.05 was set.
Because the P-value obtained from Bartlett’s test was 0.1579 which is larger than 0.05, the null hypothesis was not rejected, proceeding to a one-way ANOVA test which assumes equal population variances. A one-way ANOVA was conducted, with null hypothesis being that the population means were equal and alternate hypothesis being that population means were not equal. A significance level of 0.05 was set. The data was then graphically visualized using a graphing package included in R.
Results
Table 2. Diameters of zones of inhibition of disks in each quadrant measured using ImageJ in pixels when E. coli were incubated at 25 °C for three days. 1 mm was approximately equal to 2.36 pixels.
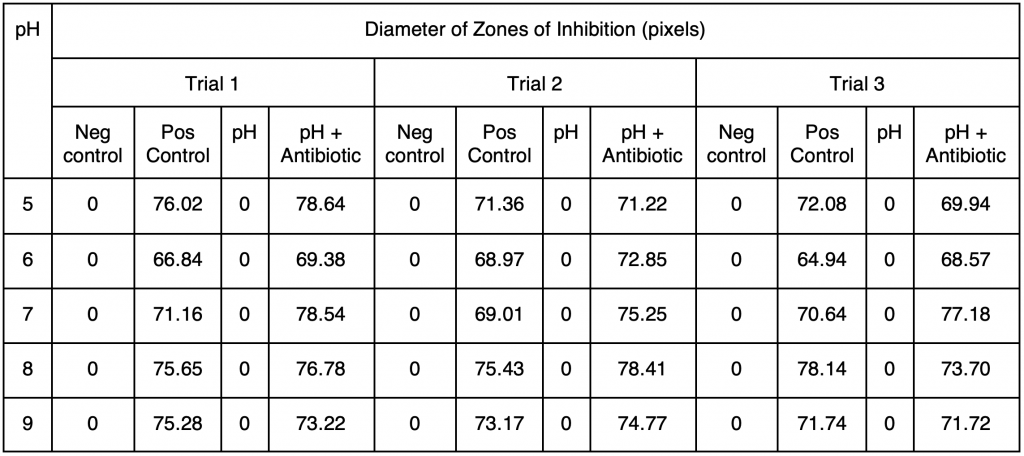
Table 3. Percent changes in diameters of zones of inhibition of combined pH and antibiotic disks compared to antibiotic only disks calculated based on data in Table 2.
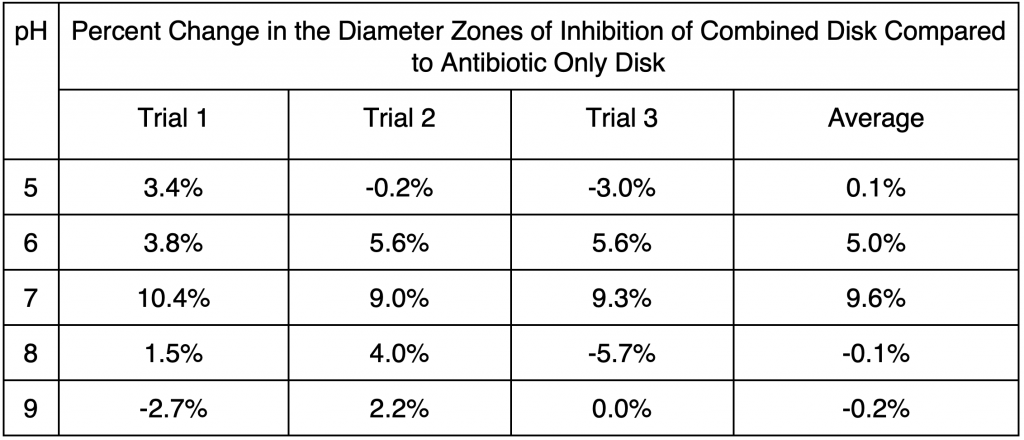
The measured changes of diameters of zone of inhibitions across the three trials for pH 7 and pH 6 were closely clustered around the averages of changes in diameters of zones of inhibition, 9.6% and 5.0% for pH 7 and pH 6 respectively. The maximum percent change was 10.4% and the minimum was 9.0%, with the difference being 1.4% for pH 7. The maximum percent change was 5.6% and the minimum was 3.8% for pH 6, with a difference of 1.8% (Table 3). In contrast, data obtained for pH 5, 8, and 9 had greater variations from the respective averages, though the measurements were relatively symmetrical for each pH (Table 3, Appendix B). The maximum and minimum percent change for pH 8 were 4.0% and -5.7% respectively, with a difference of 9.7%, which was more than that of pH 6 and 7. The maximum and minimum percent change for pH 9 were 2.2% and -2.7% respectively (Table 3), with a difference of 4.7%, also substantially larger than pH 6 and 7.
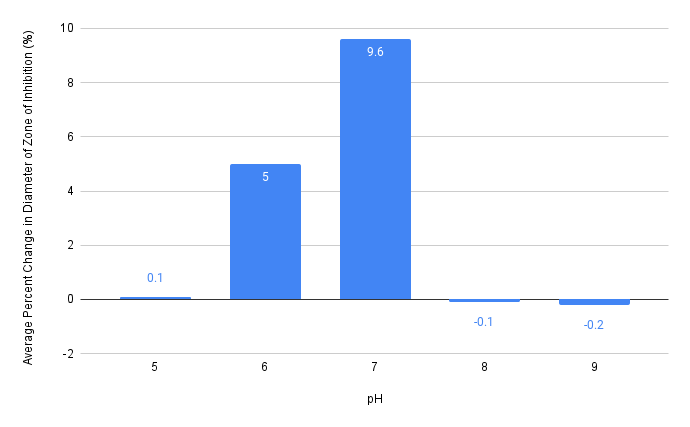
Figure 2. Effect of pH 5, 6, 7, 8, and 9 on the average percent changes of diameters of zones of inhibition of pH and antibiotic combined disks compared to antibiotic only disks. Data obtained from Table 3.
Across the five pH, the average percent changes in diameter of zones of inhibitions increased from 0.1% at pH 5 to 5.0% at pH 6 (an increase of 4.9%), then to 9.6% at pH 7 (an increase of 4.6% from pH 6) (Table 3, Figure 2). Moving to pH 8 and pH 9, however, the percent changes in zones of inhibitions dropped substantially, with pH 8 and pH 9 having averages that show a decrease in the zone of inhibitions (Figure 2). According to Table 3, the average percent change in the diameter of zones of inhibition at pH 8 is -0.1%, with average percent change even lower at -0.2% at pH 9, which corresponds to Figure 2.
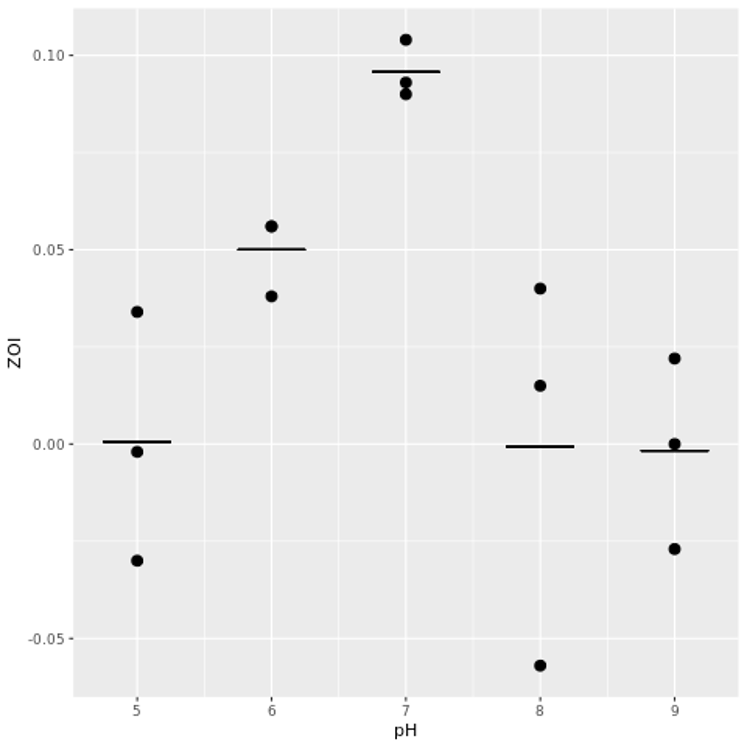
Figure 3. Visualization of one-way ANOVA conducted on percent changes of diameters of zones of inhibition across five pH. At least two averages of percent changes in diameters of zones of inhibition were statistically different, as supported by the graph and by a P-value of 0.00762 which is less than a significance level of 0.05.
Table 4. Pooled t-test conducted to determine whether the average percent changes of zones of inhibitions of two pH were statistically different. P-values were included in the table. The significance level was 0.05 with the null hypothesis being that there is no difference between the group means and the alternate hypothesis being that the group means were not equal.
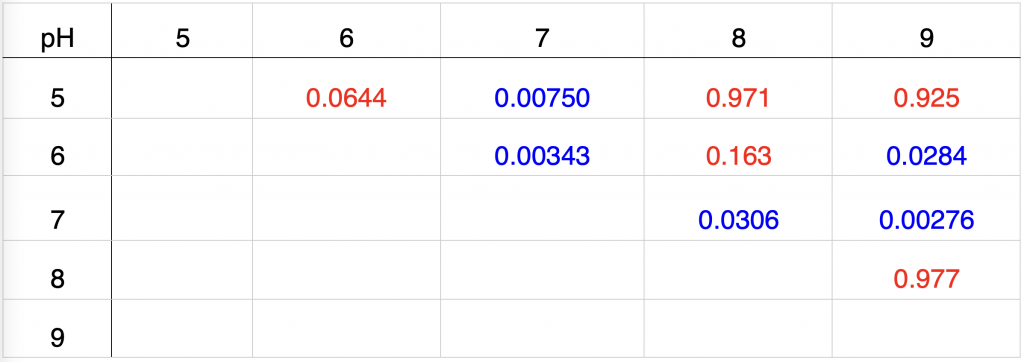
Statistical tests were conducted to determine whether the average percent changes in the diameters of zones of inhibition were statistically different. The result of the one-way ANOVA, shown in Figure 3, demonstrated that at least two means of percent changes in diameters of zones of inhibition were statistically different, which was substantiated by a P-value of 0.00762, less than a significance level of 0.05. Pooled t-tests, with their results shown in Table 4, showcased that averages between certain pH treatments were significant. The average percent change of the diameter of the zone of inhibition of pH 7 was statistically different from all other pH, with a P-value of 0.00750, 0.00343, 0.0306, and 0.00276 for pH 5, 6, 8, and 9 respectively, which are all less than a significance level of 0.05. Compared to pH 7, pH 6 led to P-values of 0.0644, 0.163, and 0.0284 against pH 5, 8, and 9 respectively. Because the significance level was set to 0.05, the average percent change of diameter of zone of inhibition at pH 6 was statistically different from the average at pH 9, but was not statistically different from the averages at pH 5 and 8. Compared to pH 7 and 6, pH 5, 8, and 9 showed no statistical difference between each pair, with a P-value of 0.9710 between pH 5 and 8, 0.9251 between pH 5 and 9, and 0.9768 between pH 8 and 9, which are all very close to a P-value of 1.
Discussion
This experiment tested the effect of pH against the zones of inhibition created by Neomycin inhibiting E. coli growth, thereby determining the effect of pH on antibiotic resistance of E. coli against Neomycin. Among the five pH tested, pH 7 led to the highest percent increase in the diameter of the zone of inhibition, followed by pH 6 (Table 3, Figure 2). Additionally, pH 6 and pH 7 demonstrated greater consistency across the three trials as shown by the fact that the data obtained across the three trials were clustered closely around the average percent change in diameter of the zones of inhibitions (Table 3). This implies that treating antibiotic disks in pH 6 and pH 7 not only led to greater increase of zones of inhibitions but also resulted in greater consistency of results, which would be preferable for potential usage of Neomycin in different pH to treat bacterial infections across the human body. Statistical tests had shown that pH 7 was the most effective treatment as it was significantly different when compared to all other pH, followed by pH 6, which was limited in its effectiveness because it was only statistically different compared to pH 9 (Table 4, Figure 3).
Previous research conducted on the topic of the relationship between pH and antibiotic resistance on different bacteria and antibiotics had similar conclusions as this study. A study conducted to determine the relationship between antibiotic susceptibility and pH for uropathogenic bacteria had concluded that antibiotic activity is pH dependent and that manipulation of pH could lead to more effective therapy developed towards reducing resistant infections (Kincses et al., 2021). This corresponds to this experiment’s conclusion that manipulating the pH in which E. coli is treated against Neomycin could increase the effectiveness of Neomycin as indicated by a larger diameter of the zone of inhibition.
This experiment could be conducted on a larger scale to further validate the effect of pH on antibiotic resistance of E. coli against Neomycin. As well, better technology could be used to measure the area instead of the diameters of zones of inhibition to better understand the effectiveness of pH and to prevent varying measurements due to uneven edges of zones of inhibition. It would also be potentially worthwhile to test pH values in between integer values to refine and further specify antibiotic activity trends.
Future research could focus on testing different buffers to determine whether the effect of pH on antibiotic resistance is also dependent on the chemicals used to make buffers. Whether pH could change Neomycin from a molecular structure point of view could also be explored to better explain the effect of pH on Neomycin and its effectiveness.
Understanding the effect of pH on
antibiotic resistance of E. coli against Neomycin could enable better
understanding of antibiotic resistance on different parts of the body with
different pH. As well, it could enable the optimization of antibiotic usage in
medical settings, achieving the same treatment effectiveness with less
antibiotic usage. This could potentially slow down the progression of
antibiotic resistance. Perhaps antibiotics can be encapsulated in an
environment of a designated pH for intake to ensure that the potential of
antibiotics is maximized to diminish excess use of antibiotics, which could possibly
reduce the number of resistant infections occurring per year.
References
“Are the Means Equal?” National Institute of Standards and Technology, www.itl.nist.gov/div898/handbook/prc/section4/prc43.htm. Accessed 10 Apr. 2023.
“CDC: 1 in 3 Antibiotic Prescriptions Unnecessary.” CDC, 1 Jan. 2016, www.cdc.gov/media/releases/2016/p0503-unnecessary-prescriptions.html. Accessed 20 Feb. 2023.
Cronan, Kate M. “The Danger of Antibiotic Overuse.” KidsHealth, The Nemours Foundation, July 2019, kidshealth.org/en/parents/antibiotic-overuse.html. Accessed 20 Feb. 2023.
Frost, Jim. “Benefits of Welch’s ANOVA Compared to the Classic One-Way ANOVA.” Statistics by Jim, statisticsbyjim.com/anova/welchs-anova-compared-to-classic-one-way-anova/. Accessed 10 Apr. 2023.
“dplyr base R.” dplyr, version 2.0.7, dplyr.tidyverse.org/articles/base.html?q=pull#pull-pull-out-a-single-variable. Accessed 26 Feb. 2023.
Glen, Stephanie. “Bartlett’s Test: Definition and Examples.” Statistics How to, www.statisticshowto.com/bartletts-test/. Accessed 20 Feb. 2023.
“How to Create DataFrame in R (with Examples).” Data to Fish, 15 Oct. 2022, datatofish.com/create-dataframe-in-r/. Accessed 20 Feb. 2023.
“Keep Rows that Match a Condition.” dplyr, version 2.0.7, dplyr.tidyverse.org/reference/filter.html. Accessed 26 Feb. 2023.
Kincses, Annamária, et al. “The Relationship between Antibiotic Susceptibility and pH in the Case of Uropathogenic Bacteria.” Antibiotics, vol. 10, no. 12, 23 Nov. 2021, p. 1431. PubMed, https://doi.org/10.3390/antibiotics10121431.
“Line Segments and Curves.” ggplot2, version 2.0.7, ggplot2.tidyverse.org/reference/geom_segment.html. Accessed 26 Feb. 2023.
Moennighoff, C., et al. “Phenotypic Antimicrobial Resistance in Escherichia Coli Strains Isolated from Swine Husbandries in North Western Germany – Temporal Patterns in Samples from Laboratory Practice from 2006 to 2017.” BMC Veterinary Research, vol. 16, no. 1, 3 Feb. 2020. BMC Veterinary Research, https://doi.org/10.1186/s12917-020-2268-z.
“National Infection and Death Estimates for Antimicrobial Resistance.” Center for Disease Control and Prevention, CDC, 13 Dec. 2021, www.cdc.gov/drugresistance/national-estimates.html. Accessed 20 Feb. 2023.
“Neomycin, Oral Tablet.” Healthline, www.healthline.com/health/drugs/neomycin-oral-tablet#side-effects. Accessed 20 Feb. 2023.
NNK. “R Group by Mean with Examples.” SparkBy{Examples}, 28 Feb. 2022, sparkbyexamples.com/r-programming/group-by-mean-in-r/. Accessed 26 Feb. 2023.
Percival, Steven L., and David W. Williams. “Escherichia Coli.” Microbiology of Waterborne Diseases, 2014, pp. 89-117, https://doi.org/10.1016/B978-0-12-415846-7.00006-8.
“Preparation of pH Buffer Solutions.” AnalChem Resources, delloyd.50megs.com/moreinfo/buffers2.html. Accessed 9 Feb. 2023.
Thomas, John, et al. “The Affect of PH and Bacterial Phenotypic State on Antibiotic Efficacy.” International Wound Journal, vol. 9, no. 4, 19 Dec. 2011, pp. 428-35, https://doi.org/10.1111/j.1742-481X.2011.00902.x.
Veirup, Niel, and Chris Kyriakopoulos. “Neomycin.” National Library of Medicine, Jan. 2022, www.ncbi.nlm.nih.gov/books/NBK560603/. Accessed 25 Feb. 2023.
“What Is Antibiotic Resistance.” Missouri Department of Health and Senior Services, health.mo.gov/safety/antibioticresistance/generalinfo.php. Accessed 6 Apr. 2023.
Williams, B. J. “Factors Which Influence Synergism by Neomycin and Oxytetracycline.” Applied Microbiology, vol. 21, no. 4, Apr. 1971, pp. 668-72, https://doi.org/10.1128/am.21.4.668-672.1971.
Zach.
“How to Perform Bartlett’s Test in R (Step-by-Step).” Statology, 25
Feb. 2021, www.statology.org/bartletts-test-in-r/. Accessed 20 Feb. 2023.
Appendix A
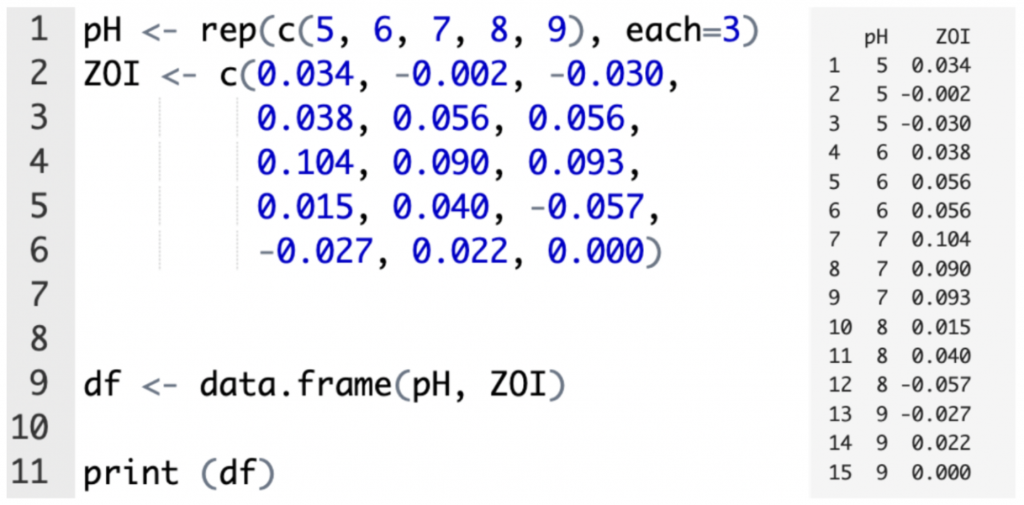
Figure 4. Creation of data frame with experimentation results (“How to Create”); output is shown on the right.

Figure 5. Bartlett’s test for homogeneity of variances with output (Zach, 2021).

Figure 6. One-way ANOVA to determine if at least two means of percentages of changes in diameters of zones of inhibition were significantly different.
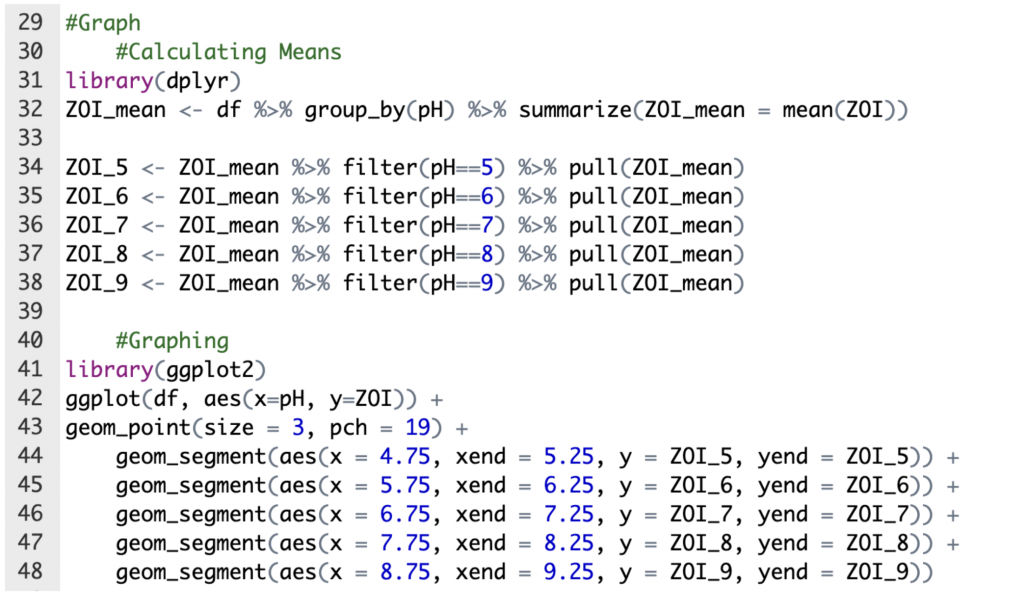
Figure 7. Creation of graph of visualization of one-way ANOVA (“dplyr base R”; “Keep Rows”; NNK, 2022; “Line Segments”).
Appendix B
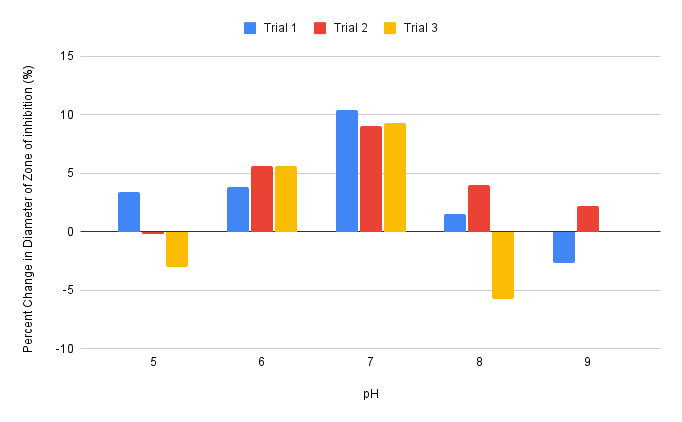
Figure 8. Effect of pH 5, 6, 7, 8, and 9 on the percent changes of the diameters of zones of inhibitions of pH and antibiotic combined disks compared to antibiotic only disks across three trials. Data obtained from Table 3.