Derek Yu, Applied Science
Abstract
Why do neurons have various functions? Testing differences in physical properties, particularly conductivity, may provide insight. Upon dissecting ex vivo sheep brains and measuring the voltage across various neuronal regions, data collected displayed distinct differences between different regions but similar readings for the same regions. Ex vivo sheep brains exhibited similar trends of voltage readings for the corpus callosum, pineal gland, olfactory bulb, thalamus, hypothalamus, cerebellum, midbrain, pons, medulla oblongata, superior colliculus, inferior colliculus, cerebral gray and white matter, and spinal cord. That suggests a direct connection between brain function and conductivity. Controlled laboratory research may help further that hypothesis, possibly even identifying a formulaic correlation between the two variables.
Introduction
It is known that neurons communicate by sending action potentials down axons and stimulating neurotransmitters across synapses to create the possibility of provoking another action potential. However, a lack of research has been done to address the specific conductivity of various forms of brain tissue. Motora, Y. (1903) proposed a liquid property of action potential transfer, in which the volume of synaptic connections changes in correspondence to the electrical current sent, an interesting concept in itself, but left the principle unanswered. This study now seeks to examine the physical properties of conductivity within different areas of brain tissue. If the conductivity of different regions is similar, then there is likely no connection between brain function and conductivity. The opposite possibility, where the conductivity of different regions is distinct yet consistent with other trials on the same region, could suggest a direct relationship between function and conductivity. If a relationship between neuronal conductivity and brain function is directly proven, it could prove to be a dramatic contribution to surgical fields, artificial intelligence models, and medicine for neurodevelopmental disorders.
Materials and Methods
In order to measure the conductivity of specific neuronal regions, the brain must be dissected beforehand. Each sheep brain in ex vivo (from a butcher’s shop, originally imported from Australia) was defrosted under warm water in preparation, then transferred on to a dissection tray. One medical scalpel and one set of tweezers was used to complete the separation of the corpus callosum, pineal gland, olfactory bulb, thalamus, hypothalamus, cerebellum, midbrain, pons, medulla oblongata, superior colliculus, inferior colliculus, spinal cord, and cerebral gray and white matter (see Fig. 1). Upon dissection, two probes connected to a multimeter were inserted into either end of each neuronal region to read the voltage in millivolts. Results were recorded only after each reading stopped fluctuating. In between readings, organic matter on the two probes was wiped off using a clean paper towel.
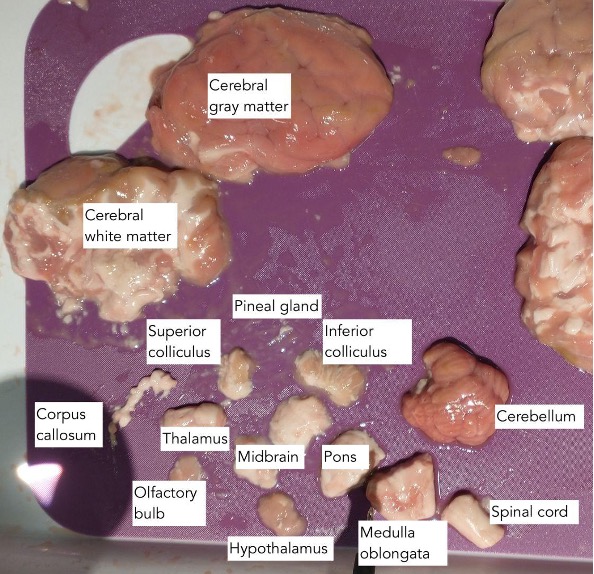
Figure 1: Dissected brain from trial A4
Results
A total of 10 ex vivo sheep brains were dissected for this experiment and were used over the course of 5 weeks. The first 6 brains, called the A trials, were from the same package. The last 4 brains, called the B trials, were from another package. All brains came from the same supplier. A trials displayed close correlations with each other, as well as B trials.
Table 1: Table displaying voltage readings from all 10 trials
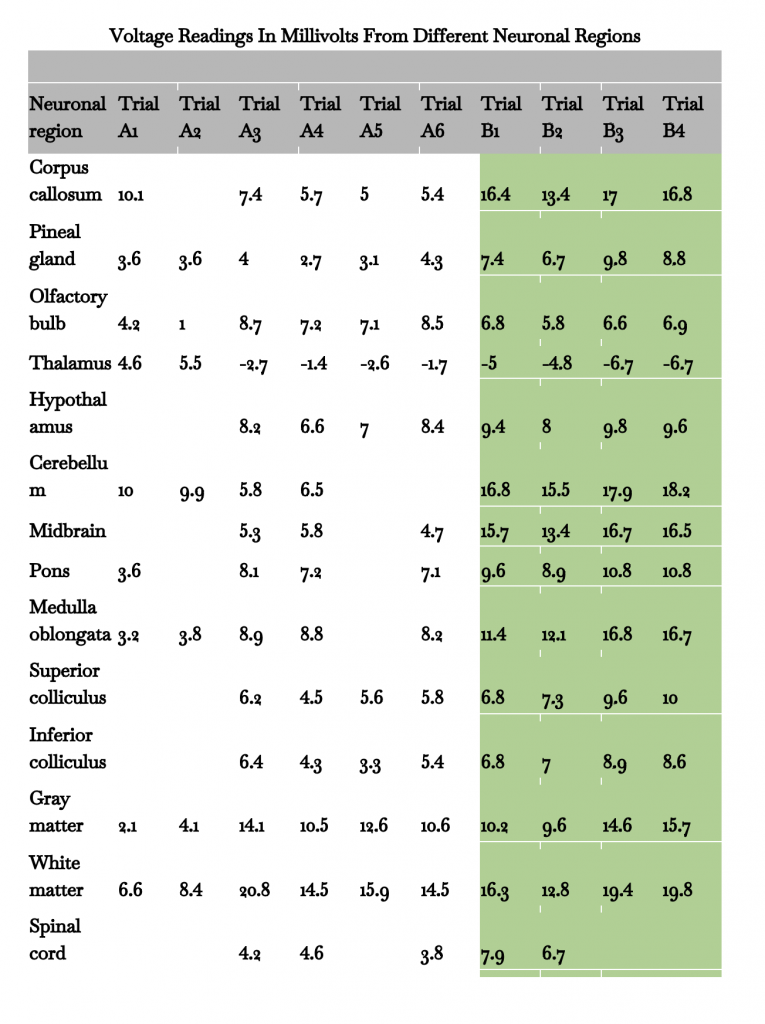
Data in green is from the B trials, while all data has an uncertainty of ±0.02mV. Some trials lack complete sets of data. For example, the brain used in trial A5 did not come with a brainstem (midbrain, pons, medulla oblongata), cerebellum, or spinal cord. Fig. 2, 3, and 4 are generated using data from table 1.
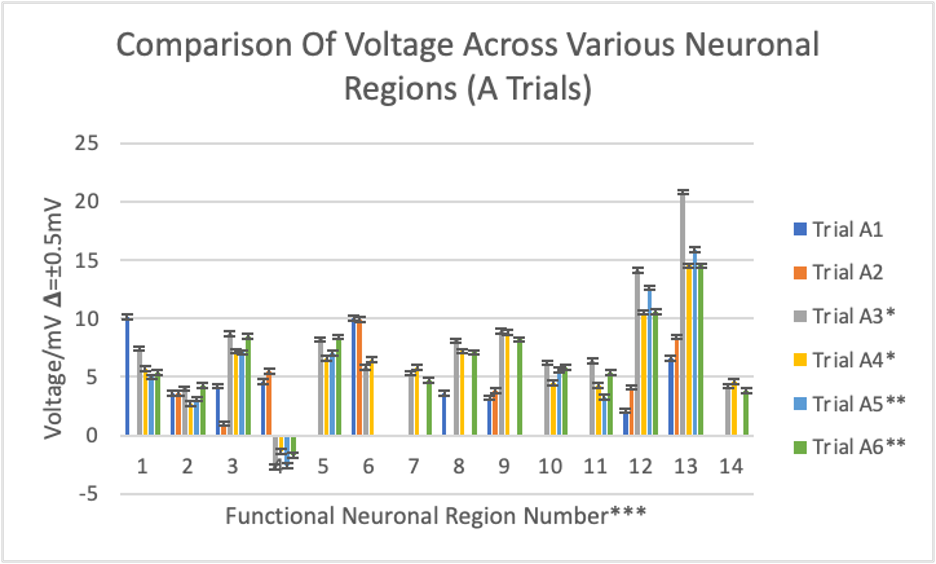
Figure 2: Bar graph displaying voltage measurements from different brains in the A trials.
* dissected one week after trials A1 and A2
** dissected one week after trials A3 and A4
*** 1-corpus callosum, 2-pineal gland, 3-olfactory bulb, 4-thalamus, 5-hypothalamus, 6-cerebellum, 7-midbrain, 8-pons, 9-medulla oblongata, 10-superior colliculus, 11-inferior colliculus, 12-cerebral gray matter, 13-cerebral white matter, 14-spinal cord
The A trials were the first 6 dissections done throughout this experiment. The cerebral white matter displayed the highest voltage reading at 20.8 mV (trial A3), while the thalamus displayed the lowest at -2.7 mV (trial A3). Trials A1 and A2 tended to display numerically different results than the other A trials. For example, cerebellum readings were around 6 mV, medulla oblongata readings were around 9 mV, cerebral gray matter readings were around 11-14mV, and cerebral white matter readings were around 14-21mV, all except for trials A1 and A2.
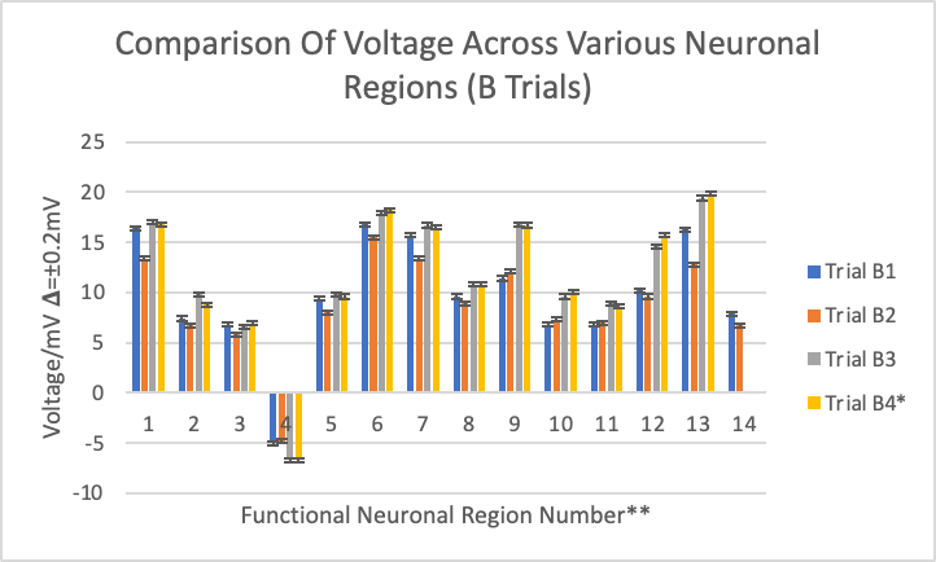
Figure 3: Bar graph displaying voltage measurements from different brains in the B trials.
* dissected one week after trials B1, B2, and B3
** 1-corpus callosum, 2-pineal gland, 3-olfactory bulb, 4-thalamus, 5-hypothalamus, 6-cerebellum, 7-midbrain, 8-pons, 9-medulla oblongata, 10-superior colliculus, 11-inferior colliculus, 12-cerebral gray matter, 13-cerebral white matter, 14-spinal cord
The B trials were the last 4 trials of this experiment. The cerebral white matter displayed the highest voltage reading at 19.8 mV (trial B4), while the thalamus displayed the lowest at -6.7 mV (trials B4 and B3 tied). Readings for trials B4 and B3 were the highest, then trial B1, and lastly trial B2 for all neuronal regions except for the olfactory bulb, medulla oblongata, superior and inferior colliculi, thalamus, and the spinal cord, which was not attached to the brains dissected for trials B4 and B3.
Voltage Readings In Millivolts From Each Trial On Separate Graphs
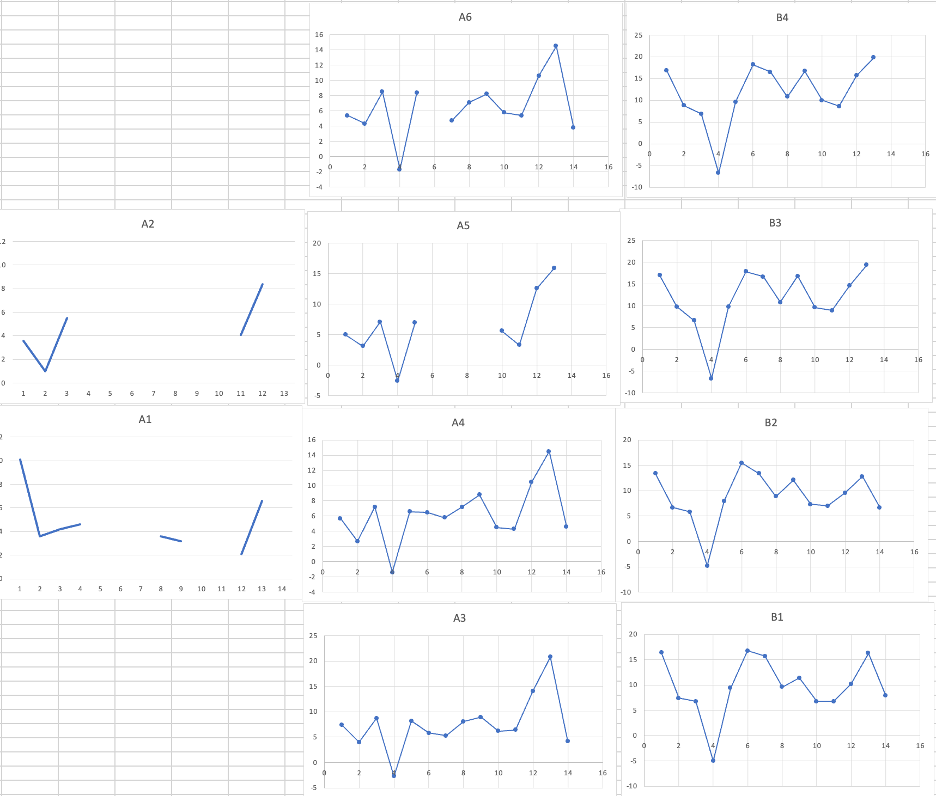
Figure 4: Separate line graphs for all 10 brain dissections’ voltage readings across the various neuronal regions
Similarly to Fig. 2 and Fig. 3, the highest reading on every graph was from the cerebral white matter and the lowest from the thalamus for trials A3, A4, A5, A6, B3, and B4. The highest readings displayed from trials B1 and B2 were from the cerebellum. Trials A1 and A2 lack many data points due to neuronal regions not attached to the brains and poor dissection.
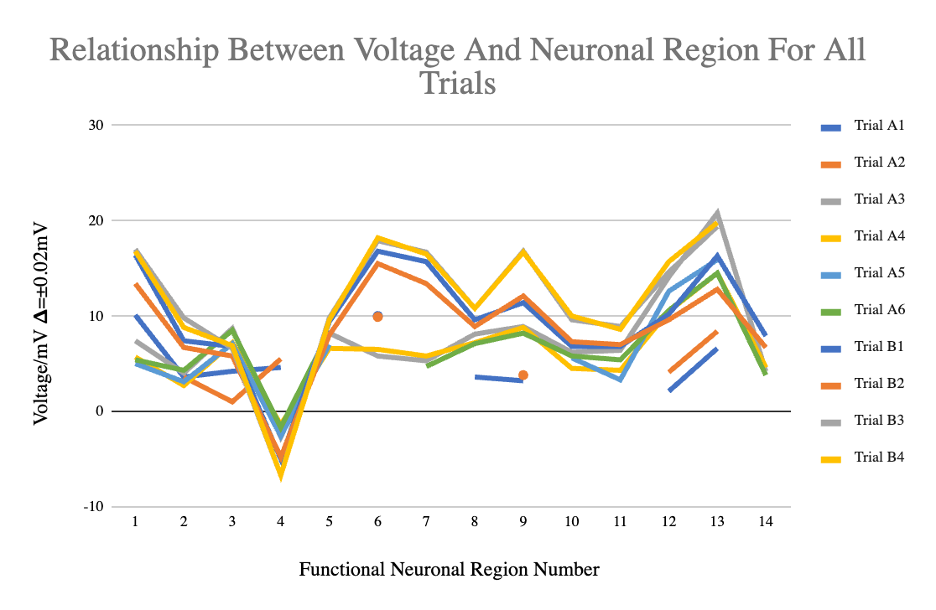
Figure 5: Line graph for all 10 brain dissections’ voltage readings across the various neuronal regions
This graph displays all 10 trials’ data together to show the similarities and differences at every neuronal region. Similar trends are exhibited by the B trials and trials A3-6. Individual plot points are joined by lines to provide a visual of the overall changes and similarities in voltage across regions.
Table 2: Table displaying mean and standard deviations of total data, all A trial tests, and all B trial tests
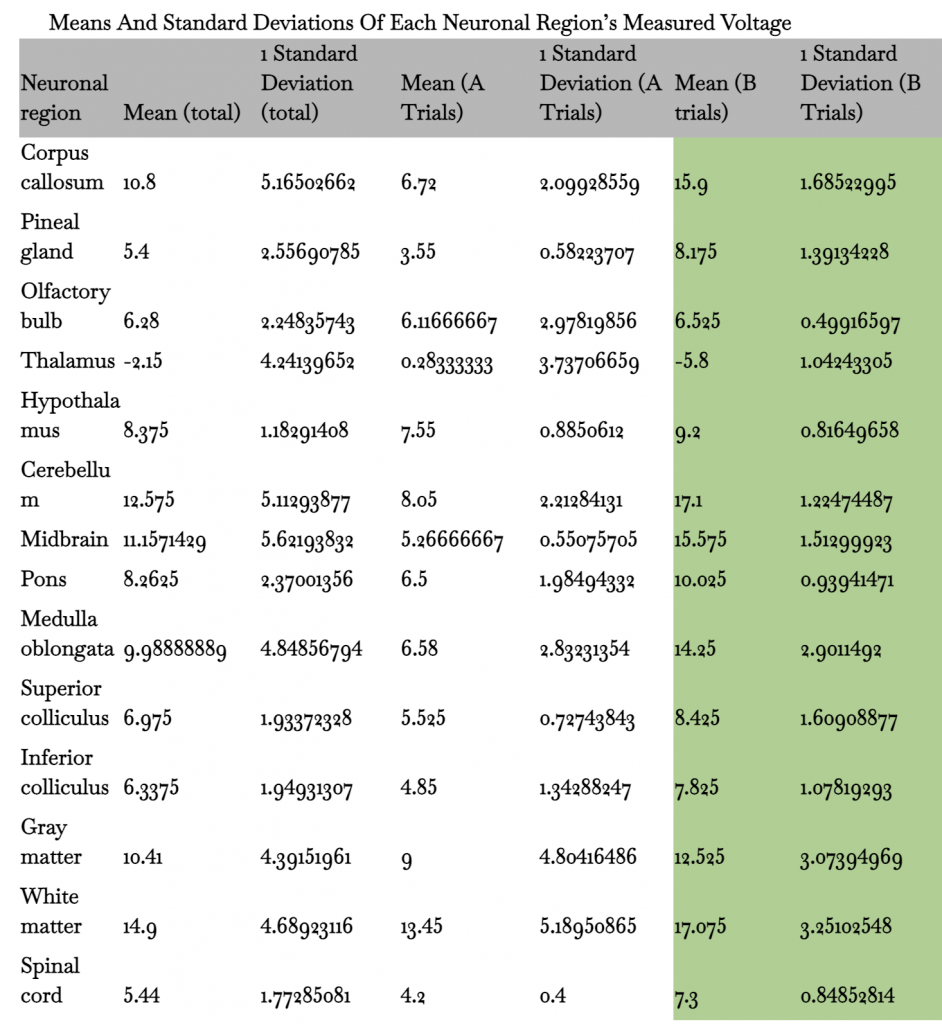
68% of all values for each neuronal region are within one standard deviation. The midbrain has the highest standard deviation for total values at approximately 5.62, while its A and B tests have a standard deviation of approximately 0.55 and 1.51. The hypothalamus has the lowest standard deviation for total values at approximately 1.18, while its A and B tests have a standard deviation of approximately 0.89 and 0.0.82.
Discussion
Results from Fig. 4 show graphs with similar shapes, despite the varying voltage values. Dividing the 10 graphs into A trials and B trials gives even clearer correlations. All B trials have a decreasing slope until 4 (thalamus), increasing slope until 6 (cerebellum), decreasing slope until 11 (inferior colliculus) (with the exception of 9 (medulla oblongata)), increasing slope until 13 (cerebral white matter) and a decreasing slope to 14 (spinal cord). Trials B3 and B4 lack data at 14 due to the brains used not having spinal cords attached. All A trials have a decreasing slope until 2 (pineal gland), increasing slope until 3 (olfactory bulb), decreasing slope until 4 (thalamus), fluctuate until 11 (inferior colliculus), increasing slope until 13 (cerebral white matter), and a decreasing slope to 14 (spinal cord). Table 2 supports this difference, as the standard deviations for A and B trials are significantly smaller than those for the total data, with most within 1 to 3. Further comparing the A and B trials, although the B trials have a negative slope from 2 to 3, it is less steep than from 1 to 2 and correlates with a positive slope in the A trials. Both trial groups display slightly negative slopes from 6 to 7 and an increase at 9.
The differences between the A and B trials were likely caused by systematic differences since every A trial displays the same differences from every B trial (ex. difference at point 3 (olfactory bulb)). The major variable that likely caused that systematic difference was that the A trials were from one package of brains, while the B trials were from another package of brains. As well, each brain displayed systematically different data (ex. trial A4 vs trial B1), which is expected as each one is from a different animal. However, the most significant detail is that despite the systematic differences, the shapes of every data set, once graphed, are strikingly similar, as can be seen in Fig. 5. That suggests a distinct difference between the conductivity of every neuronal region, which each serve different functions. Further research may be done with vivo subjects in a laboratory setting to disprove or validate this paper’s findings. If conductivity does in fact directly relate to brain function, however, humans may be able to replicate the human brain and its properties and further AI and medicinal fields.
Possible errors in data collection may have resulted from the freezing and defrosting processes. That could have especially affected trials A5 and A6, which were frozen and defrosted a total of 3 times before dissection. As well, imperfect cuts made could affect data collection. An important anomaly to note is the negative readings on the thalamus, except for trials A1 and A2. The thalamus provided the only negative readings in the entire experiment, which may have been due to the aforementioned errors or perhaps an unconsidered property of itself.
Although the results seem to support a correlation between brain function and conductivity, it is important to note the limitations on this experiment. The brains used were not specifically prepared from lab use, and although there were no direct setting-induced variables such as wind or rain, the dissections were not done in a perfectly controlled environment. Most importantly, the brains used were not vivo subjects nor human, even if the ex vivo sheep brains share similar neuronal regions.
References
Bean, B. P. (2007). The action potential in mammalian central neurons. Nature Reviews Neuroscience, 8(6), 451-465.
Churchland, P. S., & Sejnowski, T. J. (1988). Perspectives on cognitive neuroscience. Science, 242(4879), 741-745.
Clark, B. A., Monsivais, P., Branco, T., London, M., & Häusser, M. (2005). The site of action potential initiation in cerebellar Purkinje neurons. Nature neuroscience, 8(2), 137-139.
Dhamdhere, K., Sundararajan, M., & Yan, Q. (2018). How important is a neuron?. arXiv preprint arXiv:1805.12233.
Mukamel, R., Ekstrom, A. D., Kaplan, J., Iacoboni, M., & Fried, I. (2010). Single-neuron responses in humans during execution and observation of actions. Current biology, 20(8), 750-756.
Williams, R. W., & Herrup, K. (1988). The control of neuron number. Annual review of neuroscience, 11(1), 423-453.
Yuste, R. (2015). From the neuron doctrine to neural networks. Nature reviews neuroscience, 16(8), 487-497.