Claire Zhong, Life Science
Abstract
This study’s objective is to examine potential differences in perception of personality from static facial features when the individual observed is wearing a mask versus not wearing a mask. Throughout the COVID-19 pandemic, masking has potentially inhibited our ability to interact, and first-impression evaluations of personality traits can affect interactions in the long run . Subjects were randomly assigned to one of two groups, with each group either evaluating 9 unmasked or masked portraits taken of 9 different people under controlled conditions. Scores were then compared to self-evaluations of the portrait volunteers. This study found that, on average, masking negatively affects the ability to interpret personality from static facial features. This study also noted that both groups tended to be incorrect in the same direction, either overestimating or underestimating scores; this result lends itself to further investigation and study.
Introduction
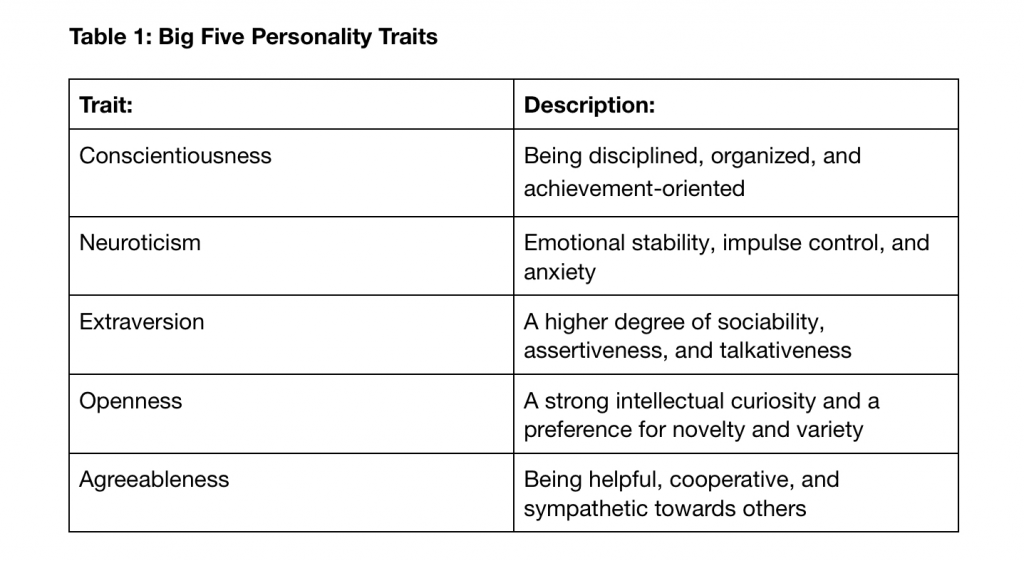
Extensive mask-wearing throughout the COVID-19 pandemic has affected our ability to interact with each other and to read other peoples’ facial expressions, potentially inhibiting our ability to find interpersonal connection, especially given that first-impression evaluations of personality traits can affect interactions in the long run (Mheidly et al., 2020). This study asks the question: does wearing a mask affect the ability of observers to determine personality traits based on static facial images? This study uses the Big Five personality traits to measure personality. The Big Five personality theory (Costa & McCrae, 1992) serves as a robust and efficient model for understanding personality. The five traits and their descriptions are described in the following table (Komarraju et al. in 2011):
Each portrait volunteer for my experiment will score themselves for each of these traits. The hypothesis of this study is as follows: if an individual is wearing a mask, the accuracy of other peoples’ evaluations of their personality would decrease (i.e. the difference between self-evaluation and peer-evaluation would be greater) relative to accuracy of evaluations of individuals not wearing face coverings.
Scoring the Big Five traits
Each of the traits can be given higher or lower scores based on the following criteria (Owens, 2021): High scorers of openness tend to be creative, adventurous, and intellectual. They enjoy playing with ideas and discovering novel experiences. Low scorers of openness tend to be practical, conventional, and focused on the concrete. They tend to avoid the unknown and follow traditional ways. High conscientiousness scorers are organized and determined, and are able to forego immediate gratification for the sake of long-term achievement. Low conscientiousness scorers are impulsive and easily sidetracked. Extraverts engage actively with others to earn friendship, admiration, power, status, excitement, and romance. Introverts, on the other hand, conserve their energy, and do not work as hard to earn these social rewards. High Neuroticism scorers are more likely to react to a situation with fear, anger, sadness, and the like. Low Neuroticism scorers are more likely to brush off their misfortune and move on. People who are high in Agreeableness experience a great deal of empathy and tend to get pleasure out of serving and taking care of others. They are usually trusting and forgiving. People who are low in Agreeableness tend to experience less empathy and put their own concerns ahead of others. These metrics were used to measure evaluations of each personality trait throughout this study.
Previous Research
Previous experiments have been able to show that humans are able to discern certain personality types accurately simply by looking at peoples’ facial features, such as a 2009 study examined the accuracy of observers’ impressions on 10 personality traits based on full-body photographs based on self and peer reports (Naumann et al., 2009). My study distinguishes itself by focusing the scope of the research on facial features and concentrating on the effect of masks. Another study assessed the Big Five personality traits using static facial images. This study touched on visual interpretation of facial features to determine personality traits, but this process was completed by a computer program, not by other humans; it ultimately found that it was possible for personality traits to be extrapolated from static facial features (Kachur et al., 2020).
Materials and methods
The study began with preparing a survey for the 9 portrait volunteers. The survey, created on the platform Google Forms, requested the following information: age, gender, ethnicity, and self-evaluations on each personality trait: openness, conscientiousness, extraversion, neuroticism, and agreeableness. In terms of age, volunteers were asked to categorize themselves in one of 5 categories: 0-15 years of age, 16-30 years of age, 31-50 years of age, 51-65 years of age, and 65+ years of age. Due to a lack of responses, this study was unable to feature participants of ages 65 and above. In terms of gender, this was an optional question; the goal was to allow for more diversity among the volunteers to minimize biases of the study participants; the same considerations were taken with the questions of ethnicity. Self-evaluations on each personality trait was a rating on a scale of 1 to 10 with a larger rating indicating more intense manifestation of the trait. Screenshots of the form structure can be found in Figures and Tables (see Figure 6).
Each portrait volunteer was assigned a five-minute time slot for their portrait to be taken in the Launchpad at Science World against the same blue wall background to control for confounding variables in the consideration of their static neutral faces. Each portrait volunteer was gifted a $10 Starbucks gift card for their time. Two portraits were taken of each volunteer: one without a mask, and one with a surgical blue face mask; each volunteer was given the same kind of mask to wear. See figure 7a and 7b for an example.
Two questionnaires were then compiled: one featuring the 9 pictures of volunteers without masks (Form B), one featuring the 9 pictures of volunteers with masks (Form A). These questionnaires featured the same questions as the first questionnaire, and in lieu of a self-evaluation of Big Five traits, subjects were asked to evaluate each portrait volunteer’s personality on the 1-10 scale described previously in this section. The subjects were FSL Year 1s; each Year 1 was randomly assigned into either group A or group B and were asked to complete the questionnaire. Form A received 16 responses, and Form B received 13. Data from the responses were compiled in a spreadsheet using Google Sheets.
To analyze the data, the difference between each participant’s response and the corresponding self-evaluation value was calculated. These values were then averaged to determine an average difference for Form A and an average difference for Form B. This process was then repeated for each of the five personality traits to calculate the average differences from the self-evaluated value for each personality trait, comparing the averages for masked and unmasked responses. A clear breakdown of the data can be found in the Results section of this paper.
Results
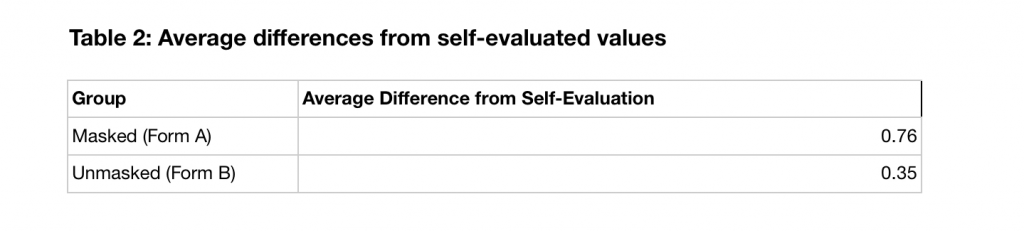
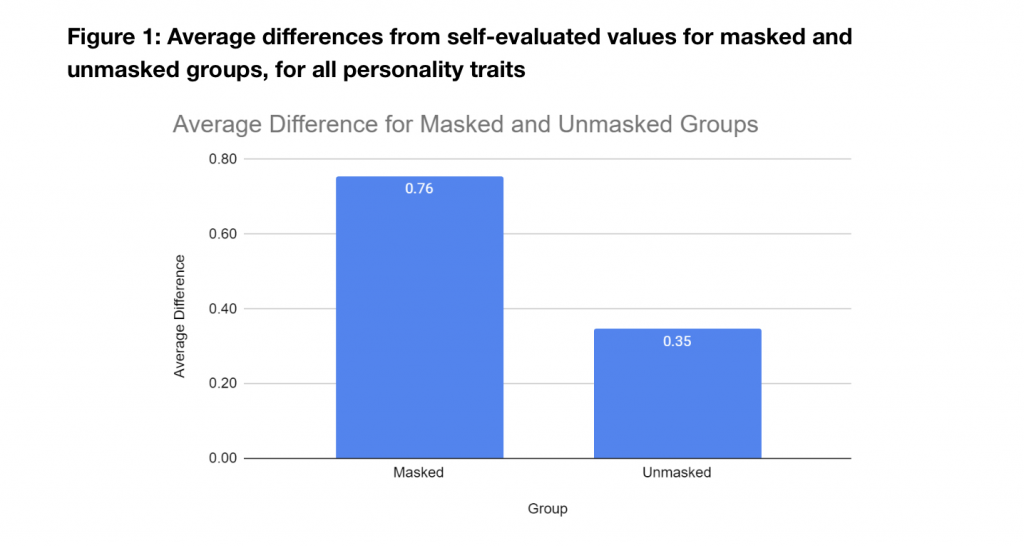
On average, the scores from Form A were 0.76 greater than the self-evaluation scores, while the scores from Form B were on average 0.35 greater than the self-evaluation scores. Therefore, when the portrait volunteers were not wearing a mask, survey responses were more accurate by 0.41, a difference of around 54%.
Breakdowns by personality trait are as follows – tables and figures can be found in the Figures and Tables section of this paper: from Table 2, agreeableness saw masked estimations 2.70 less than self-evaluations, and unmasked estimations 2.33 less than self-evaluations. From Table 3, neuroticism saw masked estimations 0.417 less than self-evaluations, and unmasked 0.991 less than self-evaluations. From Table 4, masked estimations for extraversion were 0.229 greater than self-evaluations, and unmasked estimations were 0.667 greater. From Table 5, masked estimations for conscientiousness were 1.58 greater than self-evaluations, while unmasked estimations were 1.09 greater than self-evaluations. From Table 6, masked estimations were 0.0903 less than self-evaluations, and unmasked estimations were 0.462 less than self-evaluations. Graphical representations of each table’s data can be found in the corresponding Figures 2, 3, 4, 5, and 6.
Discussion
Results demonstrate that on average, unmasked evaluations were more accurate than masked evaluations. However, the trait-by-trait breakdown demonstrates that this comparison is not consistent for every trait, and therefore it is difficult to fully conclude that the masks cause more inaccurate interpretations. Meanwhile, it is interesting to note that regardless of magnitude, both masked and unmasked groups tended either to overestimate or underestimate a personality trait in the same manner. For instance, for extraversion, both group A and group B overestimated the extraversion of the portrait volunteers. In contrast, both group A and group B underestimated the neuroticism of portrait volunteers. This same pattern can be observed for each of the five individual traits and offers an avenue for future investigation into the causes of these shared overestimations and underestimations.
Previous research suggests that self-reported personality tests are accurate in demonstrating personality traits, with researchers finding that “self-report means generally did not differ from informant-report means” (Kim et al., 2019). That notion is contested by the results in this study. Other research has been done concerning moving facial features and the Big Five personality traits; however, the focus has never been on the features themselves, including a study that used a variety of machine learning algorithms to build the identification model on 70 key points of the face, and found that certain facial movements were correlated with lower or higher scores in openness (Cai and Liu, 2022). However, this study uniquely observes how these interpretations are affected by masking. Ultimately, the results of this study are consistent with the hypothesis that masking can lead to, on average, less accuracy in personality interpretations.
References
Cai, L., & Liu, X. (2022, September 9). Identifying big five personality traits based on facial behavior analysis. Frontiers in public health. Retrieved December 16, 2022, from https://www.ncbi.nlm.nih.gov/pmc/articles/PMC9533697/
Costa, P. T., & McCrae, R. R. (1992). NEO PI-R: Professional Manual: Revised NEO PI-R and NEO-FFI. Florida: Psychological Assessment Resources, Inc..
Kachur, A., Osin, E., Davydov, D., Shutilov, K., & Novokshonov, A. (2020). Assessing the Big Five personality traits using real-life static facial images. Scientific Reports, 10(1). https://doi.org/10.1038/s41598-020-65358-6
Kim, H., Di Domenico, S. I., & Connelly, B. S. (2018). Self–other agreement in personality reports: A meta-analytic comparison of self- and informant-report means. Psychological Science, 30(1), 129–138. https://doi.org/10.1177/0956797618810000
Komarraju, M., Karau, S. J., Schmeck, R. R., & Avdic, A. (2011). The big five personality traits, learning styles, and academic achievement. Personality and Individual Differences, 51(4), 472–477. https://doi.org/10.1016/j.paid.2011.04.019
Mheidly, Nour, et al. “Effect of Face Masks on Interpersonal Communication during the COVID-19 Pandemic.” Frontiers, Frontiers, 17 Nov. 2020, https://www.frontiersin.org/articles/10.3389/fpubh.2020.582191/full.
Naumann, L. P., Vazire, S., Rentfrow, P. J., & Gosling, S. D. (2009). Personality Judgments Based on Physical Appearance. Personality and Social Psychology Bulletin, 35(12), 1661–1671. https://doi.org/10.1177/0146167209346309
Owens, M. (2022, August 18). The big five personality traits. Truity. Retrieved December 16, 2022, from https://www.truity.com/book/big-five-personality-traits
Figures and Tables
Data has been separated into 5 distinct tables based on personality traits, then presented in two graphs for each trait; the first graph is a comparison of portrait volunteers’ self-evaluation, average masked estimation, and average unmasked estimation. The second graph for each trait contrasts the difference between self and masked estimations and the difference between self and unmasked estimations for each portrait volunteer.
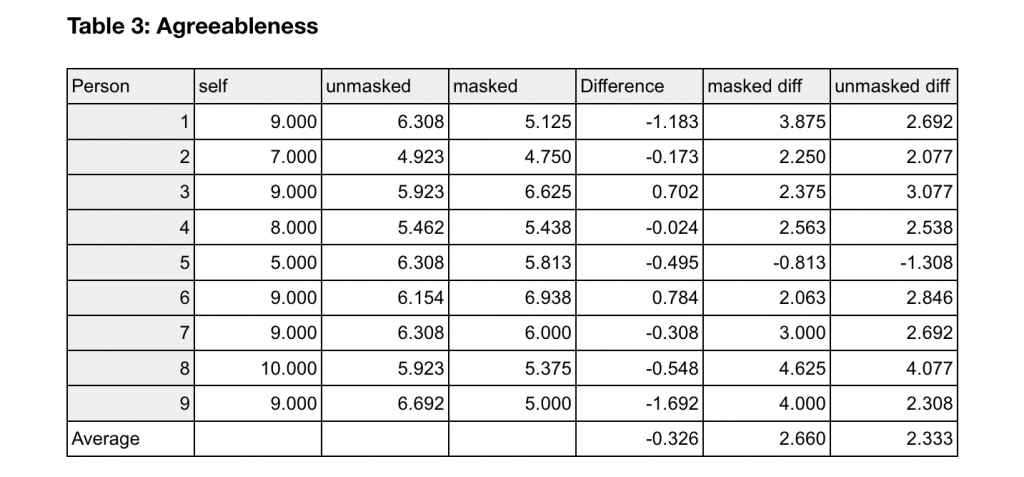
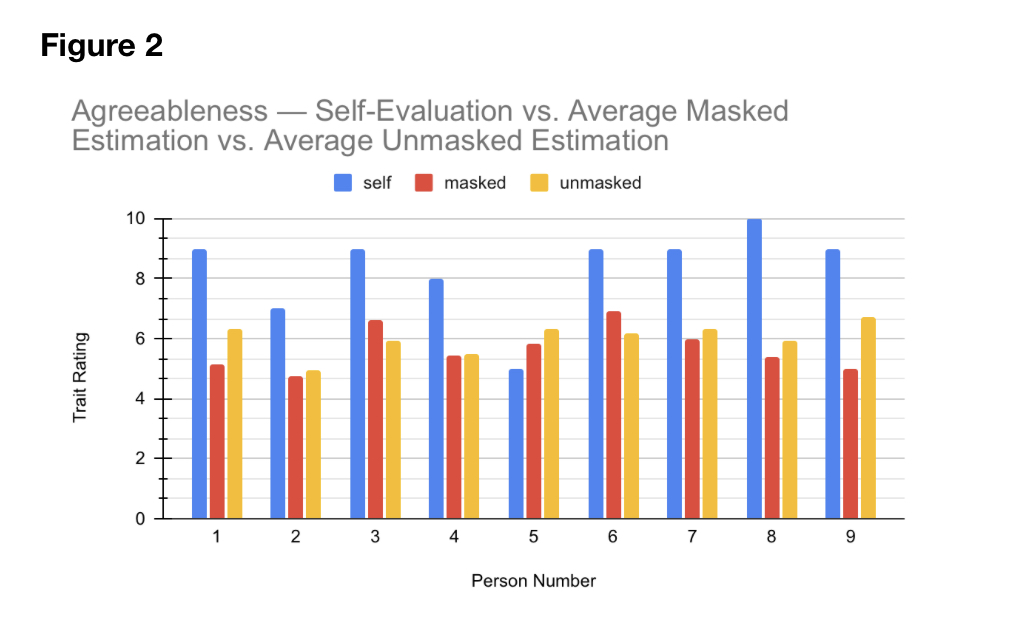
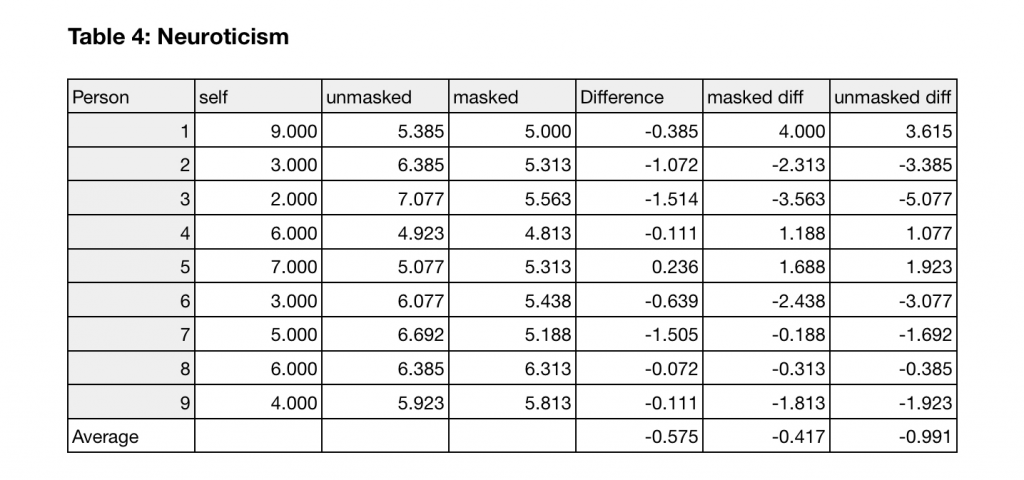
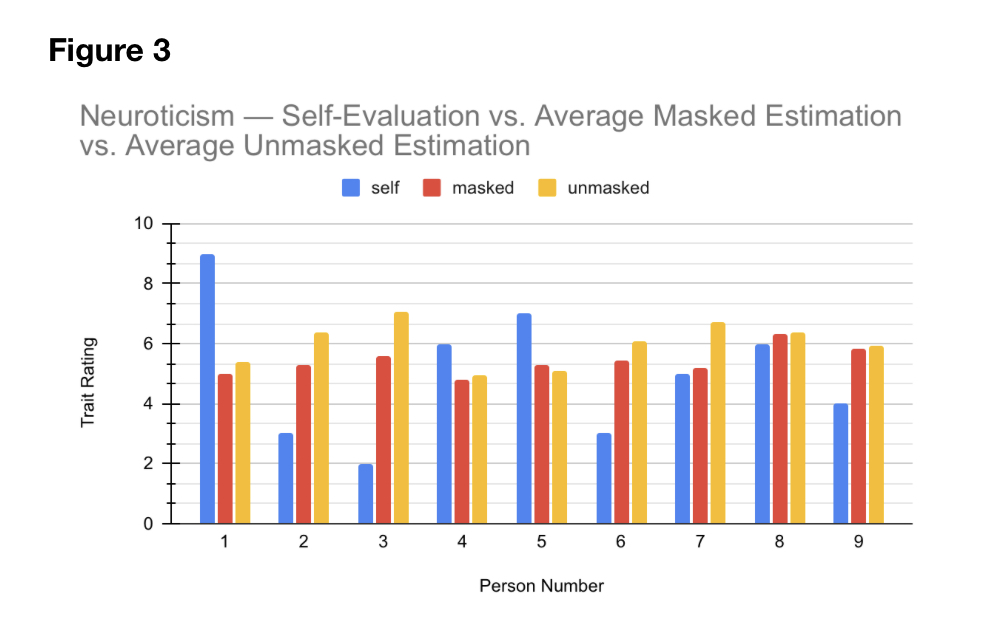
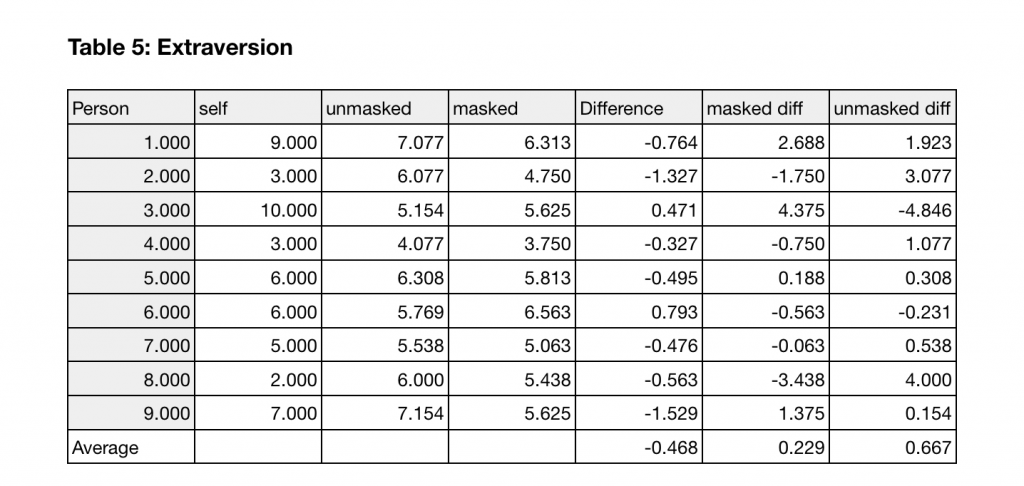
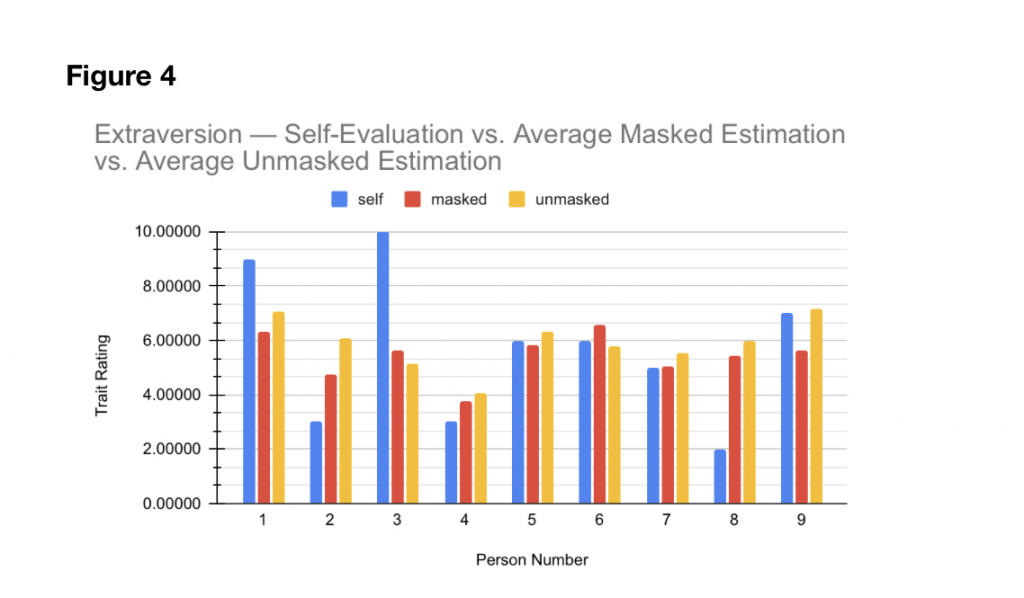
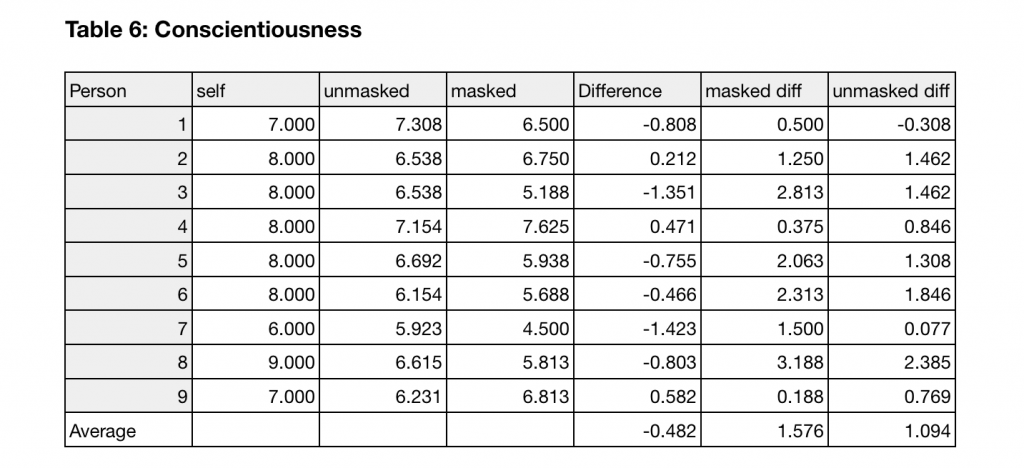
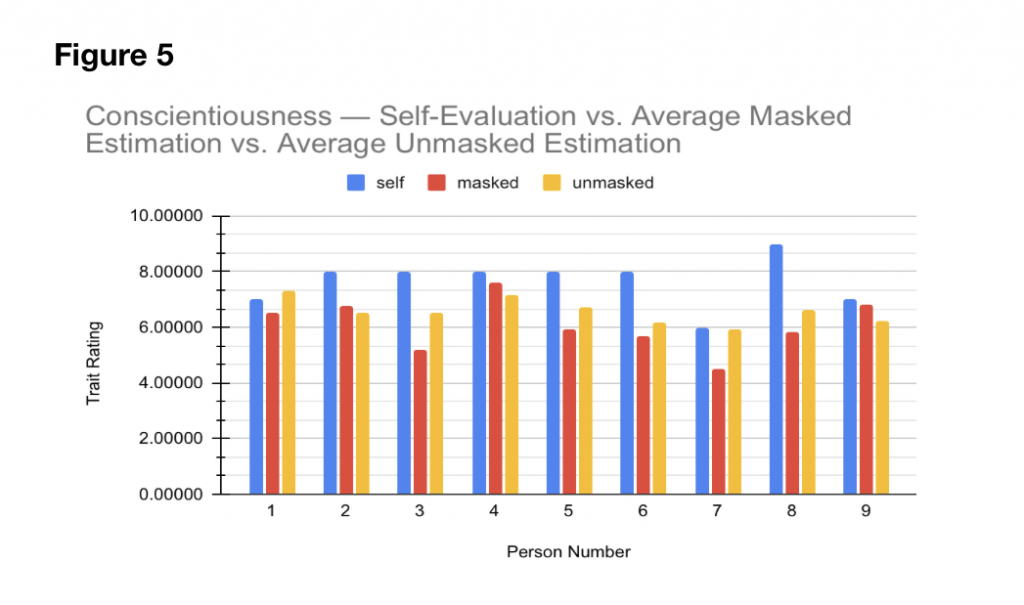
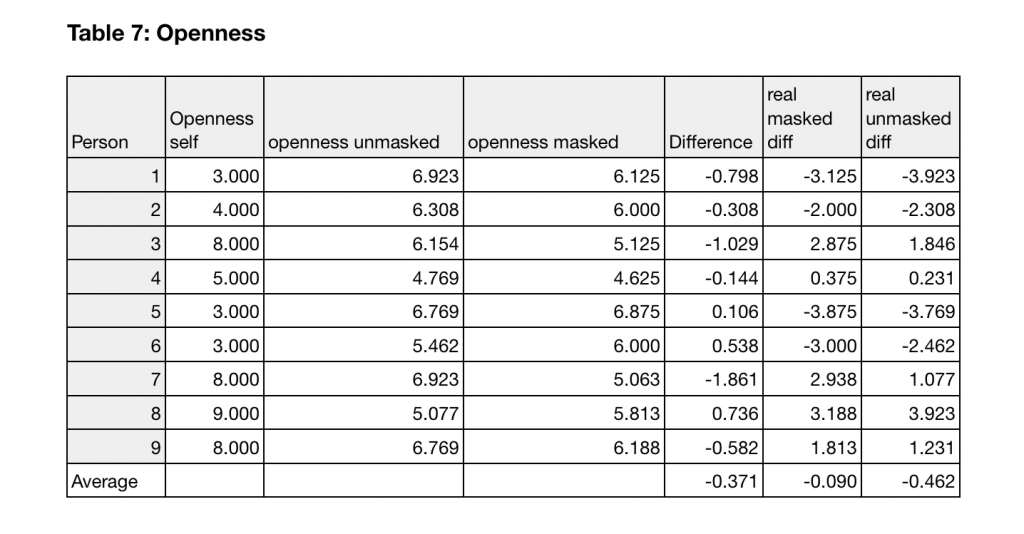
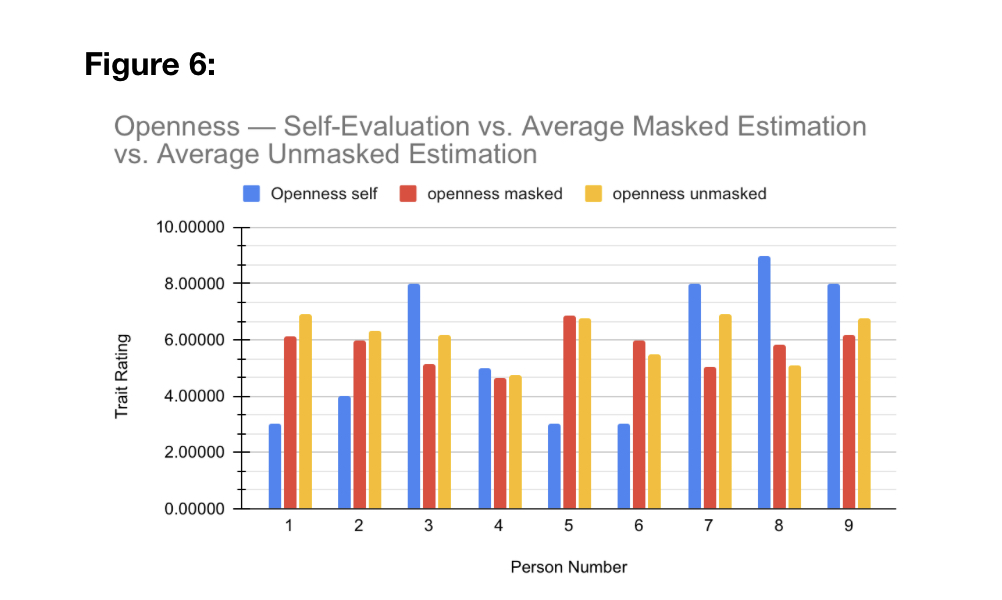
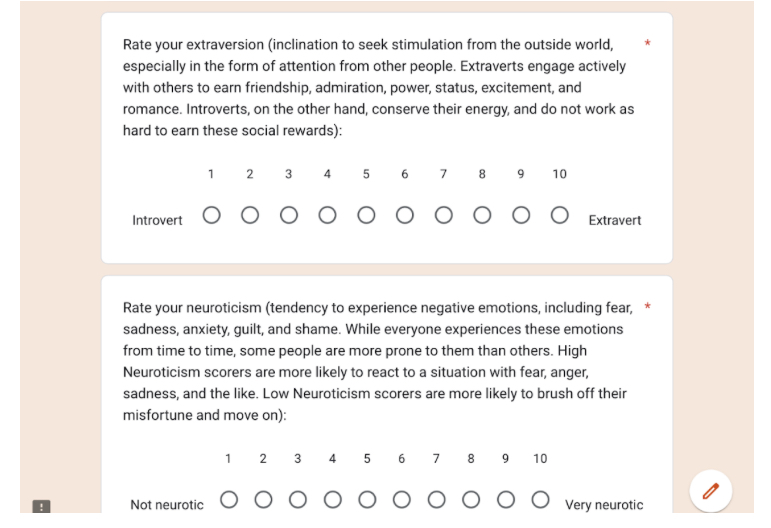
Figure 7: Form Screenshot (2 Examples of questions)
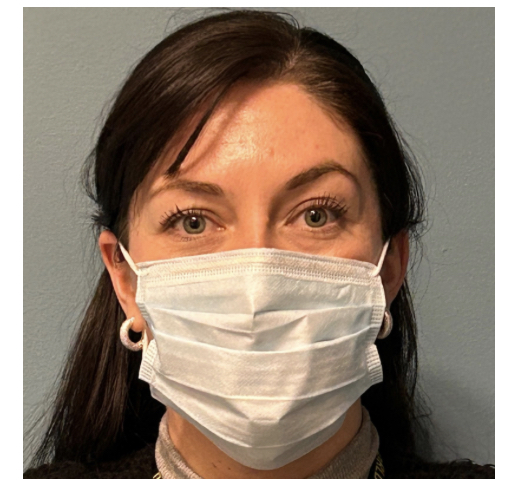
Figure 8a: Masked portrait
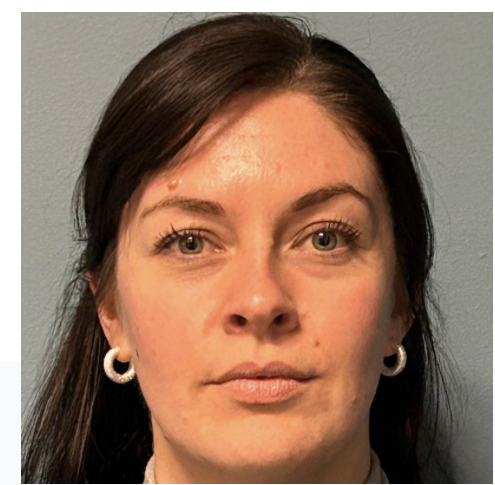
Figure 8b: Unmasked portrait