Angela Hu, Year 3
Abstract
Urbanization has led to changing population and disease dynamics. The use of mathematical models can guide health experts and policy makers in combatting disease spread specific to the needs of rural regions and urban cities. In this paper, three mathematical models, each comparing urban vs. rural regions, are developed to model the effects of vaccines, lockdowns, or contact tracing. It was found that urbanization lead to both shorter pandemics and higher total deaths across all three interventions. Additionally, urbanization produced higher numbers of infected individuals at one time, which may place significant strain on health care systems, supported by existing research. More work will need to be carried out to better incorporate all aspects impacting disease spread, including incorporating smaller scale behavioural changes such as increased hand washing.
Introduction
As the world continues to urbanize, shifting from rural regions to urban cities, population density increases. With shifting population dynamics and increasing movement of people, many researchers have found urbanization leads to increased disease spread. In Africa, which has one of the highest urbanization rates in the world (Campbell, 2018), yellow fever epidemics have been link to urbanization (Wilder-Smith & Monath, 2017). Urbanization has also been linked to HIV, with one study citing that a 10% increase in urbanization has been associated with an almost four percent increase in HIV prevalence (Dyson, 2003). Mathematically modeling disease spread can provide specific quantitative estimates of outbreaks and transmission over time, informing decision makers of best courses of action, even in scenarios with little to no data. They have historically been used in health crises including the 2014 West African EVD outbreak (Chretien et al., 2015) and the recent COVID-19 pandemic (Tuite et al., 2020). Deterministic, differential equation models divide the population into compartments (such as susceptible, infected, and removed in the SIR model), and project the population in each compartment over time.
Unfortunately, while modeling infectious disease dynamics is well explored, the correlation between urbanization and disease spread is not currently widely studied (Dyson, 2003). Compared to the relevant research available (Engebretsen et al., 2019; Moss et al., 2016), this project will also focus on specific governmental interventions not modeled, including vaccination, lockdowns, and contact tracing. These three interventions were chosen because each of them requires a unique mathematical approach, making them interesting to study. This paper will also examine different demographic, logistical, sociological, and population characteristics that are location-dependent, such as urbanized areas having more healthcare capacity, infrastructure, and services (Bai et al., 2012) but also having a higher rate of human contact (Neiderud, 2015). Thus, this paper aims to determine the impact of urbanization and interventions on disease spread over time.
Materials and Methods
Three models are designed in this paper, each modeling different interventions. The classical deterministic SIR model based on epidemiological status was used as the basis for all models, with compartments added to separate general community members and health care workers (HCW). Compartments were also added to differentiate between recovered and deceased individuals, as opposed to grouping them under “removed”. This distinction was made as recovered health care workers can continue to contribute to health care capacity. In creating this model, it was assumed that recovered individuals are immune from the disease and cannot become reinfected. To visualize the predictions of the models, a numeric computing environment (MATLAB) was used. The function ode45 was used to numerically solve the differential equations and generate these predictions.
Model 1 – Vaccines
The first model incorporates the effect of vaccination on disease spread. Susceptible (𝑆) individuals are vaccinated at the rate 𝑣, or can become infectious at a rate determined by the force of infection 𝛽 and the current infectious population 𝐼. Infected individuals leave the compartment at a rate of 𝛾, progressing to either the recovered (𝑅) or the diseased (𝐷) compartment (Figure 1.)
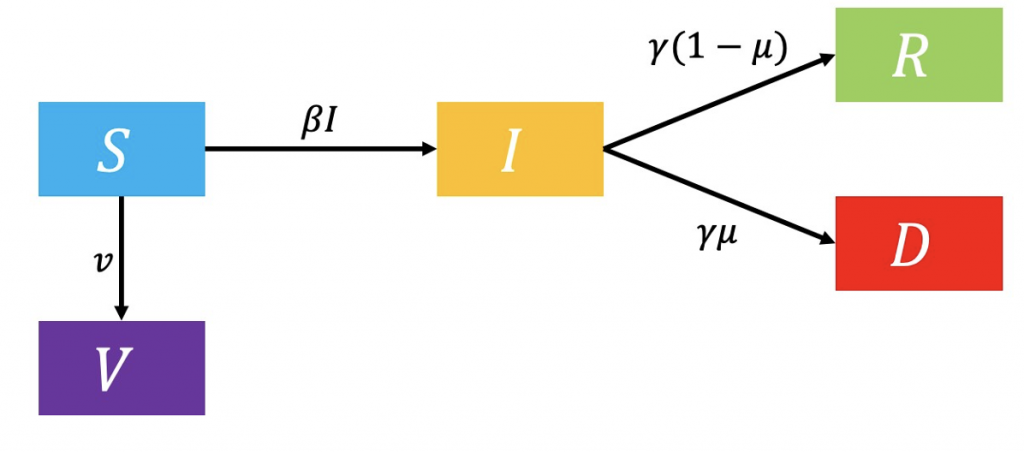
Figure 1: Flowchart of vaccination model.
The model state and parameter definitions and values are listed in Tables 1 and 2, respectively.
Table 1: Model state definitions of vaccination model.
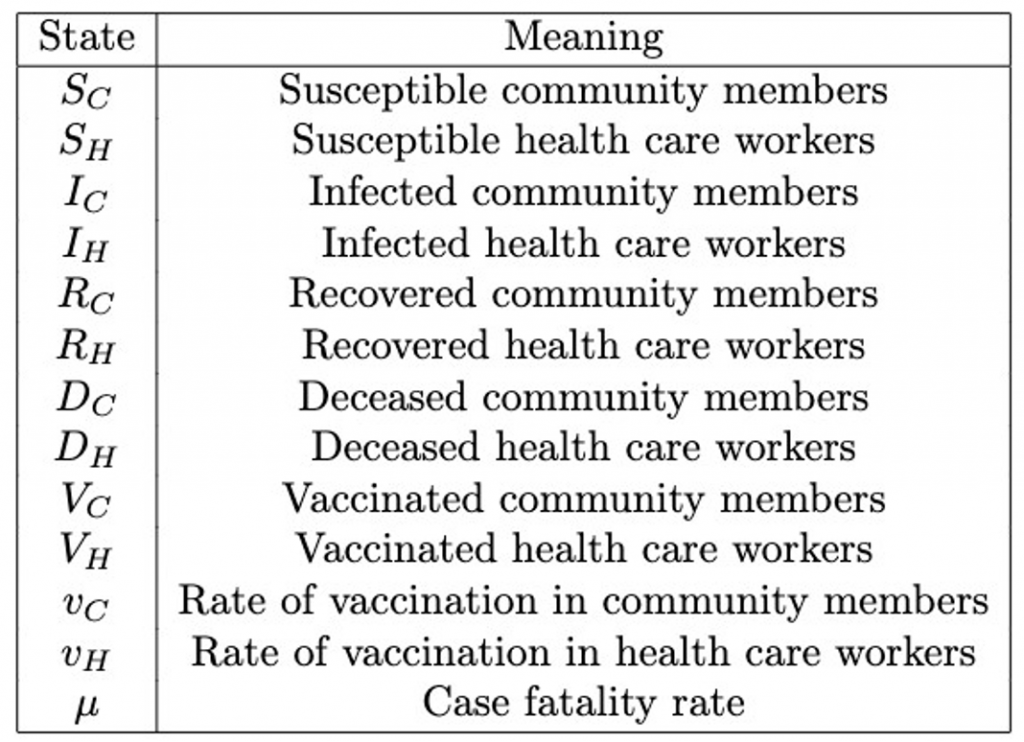
Table 2: Model parameter definitions of vaccination model.
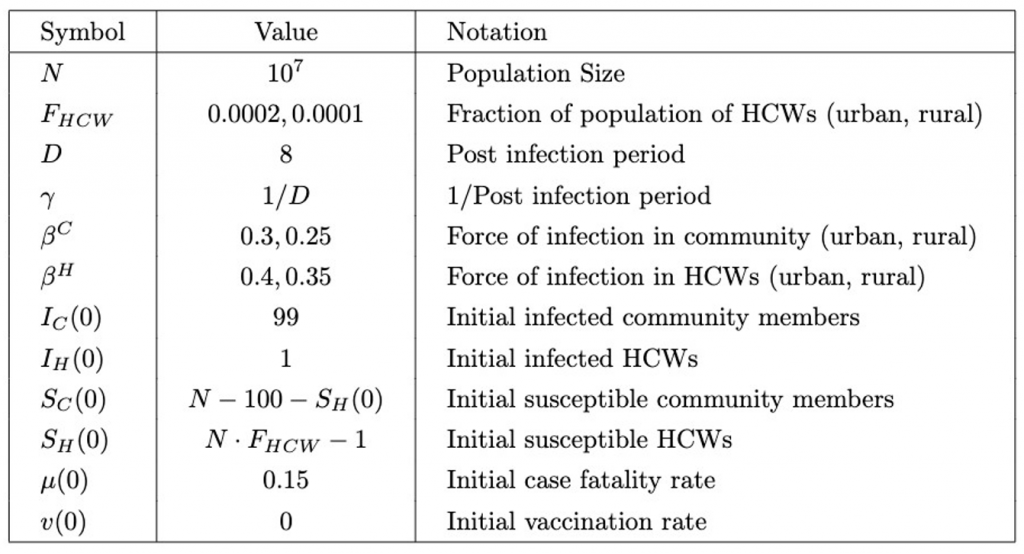
For the purpose of this model, the value of F_HCW (Table 2) was an estimation from the number of physicians per 1000 people in sub-Saharan Africa (World Bank, 2017). It is lower in rural areas, as there are typically fewer health care workers due to poorer access to education and rural flight, in which doctors move to urban areas due to better job prospects (higher salaries, more benefits, and better working conditions) (Rural Healthcare Workforce, 2020).
The force of infection is lower in community members than health care workers (Beta^C < Beta^H), as interactions between infectious individuals and health care workers are assumed to be more prevalent and longer, with a higher chance of close contact and transmission of bodily fluids during treatment. Additionally, a higher force of infection is allowed in urban populations than rural, as a lower population density leads to less human contact and thus less chance of spread (Moss et al., 2016).
All compartments are initially set to zero, except for the susceptible and infected individuals that provided a trigger for the epidemic.
The equations comprising this model are as follows:
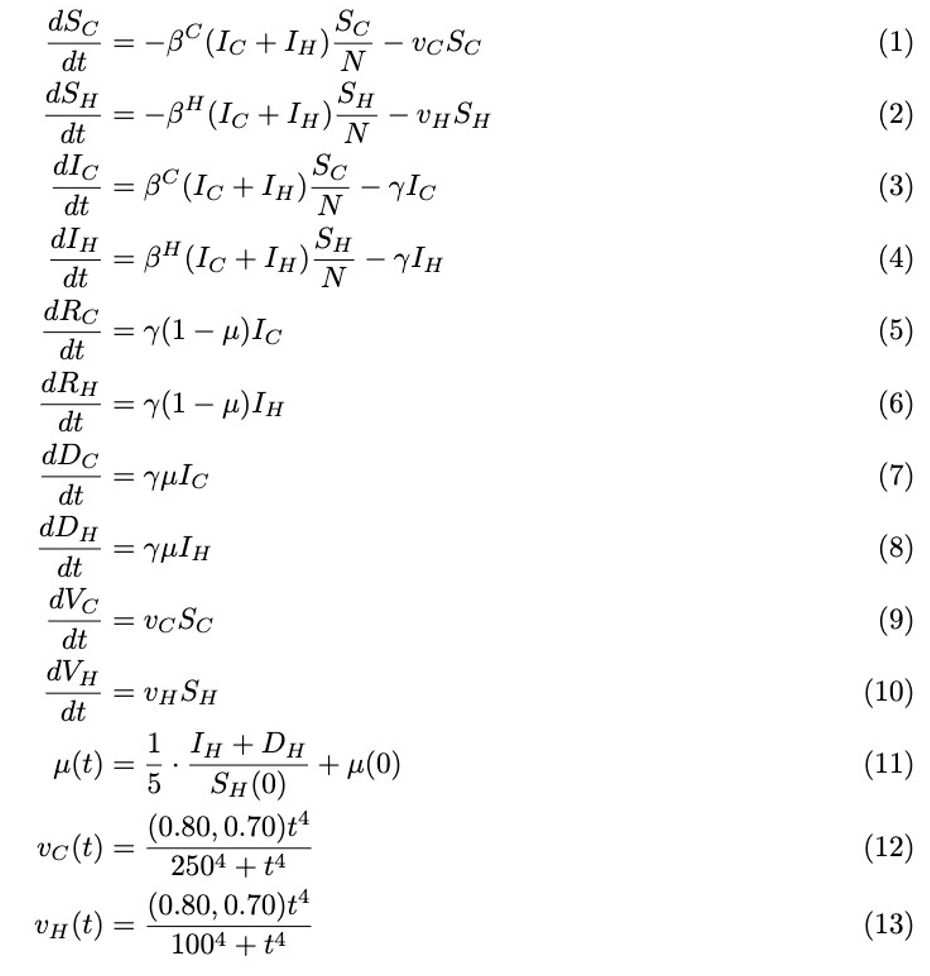
The case fatality rate (equation 11) is a time varying quantity and is dependent on health care deficit as health care workers can no longer work, either due to infection or death.
Equations 12 and 13, modeling rates of vaccination in community members and health care workers respectively, are defined using the Hill equation, chosen solely on the grounds that it has the desired shape and is commonly used in biological models (Hill Equation – Interactive Graph, 2014). Vaccination rates increase slowly near the beginning of the pandemic, as trials are conducted, before rising more rapidly. As time progresses, the proportion of the population continuing to get vaccinated increases at a lower rate as those who want to and can get vaccinated have already received the vaccine. The Hill equation typically models biological interactions exhibiting sigmoidal behaviors, plotting reaction velocity (𝑉) against substrate concentration [𝑆]:
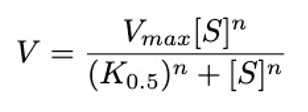
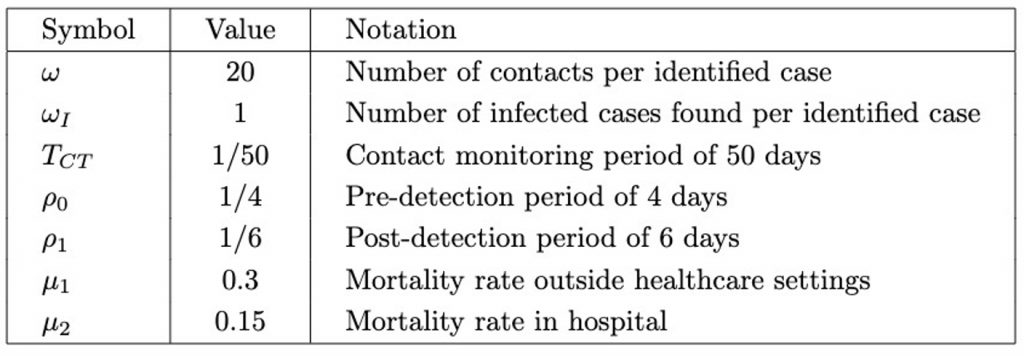
This equation involves three important parameters: V_max is the maximum velocity of the reaction, K_0.5 is the half-maximal concentration constant, or the substrate concentration at which the reaction rate is half of V_max, and 𝑛 is the Hill coefficient.
To model the population of community or health care workers that has been vaccinated with respect to time, the Hill equation was adapted. V_max was replaced with a proportion of the respective compartment, i.e. the maximum assumed number of people that will be vaccinated. The portion of the population that never receives the vaccine was attributed to anti-vaxxers, those with health conditions prohibiting them from receiving it, and those without access to vaccines. It was assumed that a lower proportion of rural dwellers would ultimately be vaccinated than urban, due to less access to health facilities and vaccine distribution centers (Ameyaw et al., 2021). Additionally, a belief in traditional medicine primarily in rural areas may cause fewer people to choose to be vaccinated against disease. [𝑆] was replaced with 𝑡, time. K_0.5 was replaced with the point in time when exactly half the population of community or health care workers is vaccinated, shorter for health care workers as they are assumed to have earlier access to the vaccine and are more willing to be vaccinated. The value of 𝑛 was chosen to be 4 as it generates the desired shape.
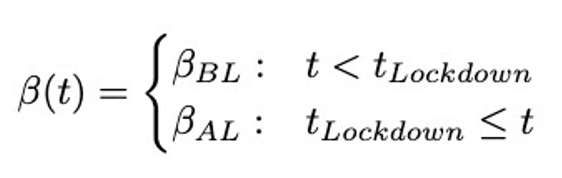
Model 2 – Lockdowns
The second model examines the effect of lockdowns on pandemics, such as travel restrictions, work-from-home mandates, and restaurant closures. While 𝛽 still represents the force of infection, it is made a function of time in this model (Figure 2.)
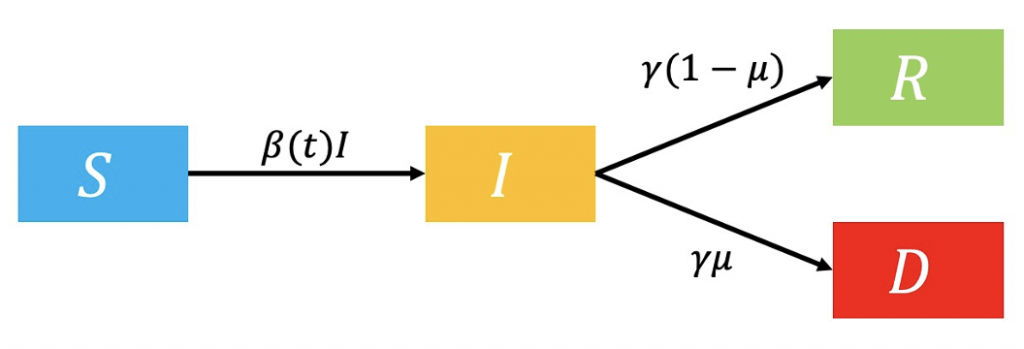
Figure 2: Flowchart of lockdown model.
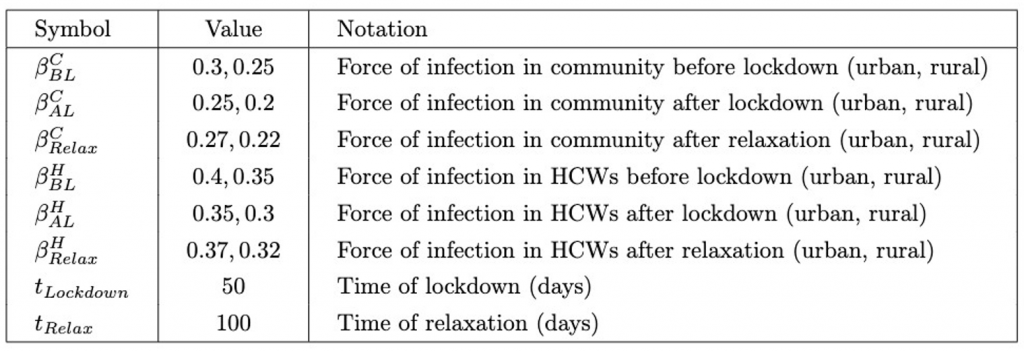
As 𝛽 represents a probability of a susceptible individual entering the infectious compartment, its value lowers during lockdowns as a result of fewer human contacts (Khedher et al., 2021). It will have the following values before and after the lockdown:
As in the COVID-19 pandemic, there may be more than one wave of infections. To predict a second wave, this two-stage model can be slightly extended to a three stage model, where the new transmission rate Beta_Relax is introduced after the relaxation of restrictions.
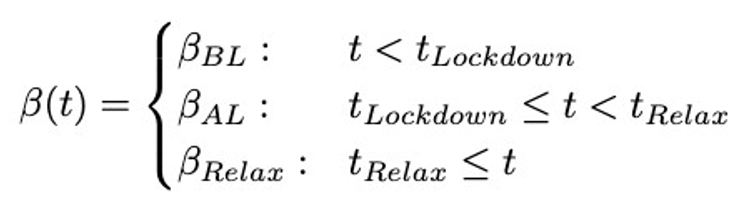
These parameters will take on the values shown in Table 3. After the relaxation, the force of infection increases but does not return to a value higher than that before the lockdown, as some health measures may continue to persist.
Table 3: Model parameter values of lockdown model.
Model 3 – Contact Tracing
The third model provides information on the impact of contact tracing (Figure 3.) Susceptible individuals are contact traced at rate N_CT and directly hospitalized, or infected (Moss et al., 2016). Ascertainment of cases (p_asc) allows infected individuals to also enter the hospitalised compartment, decreasing the probability of death.
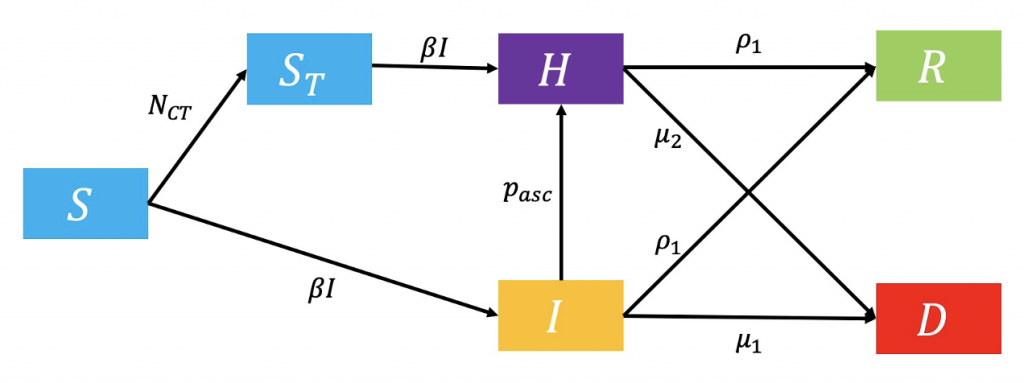
Figure 3: Flowchart of contact tracing model.
New compartments and parameters are introduced (Tables 4 and 5.)
Table 4. Contact Tracing Model State Definitions.
Table 5: Additional Contact Tracing Model Parameters.
The equations of this model are as follows:
Effective health care capacity (equation 25) depends on the number of available health care workers at a given time as a proportion of the original number.
In equations 26 and 27, 𝑒 is multiplied by a factor of 0.25 due to 1 isolation ward bed for every 4 health care workers. The fraction of health care workers hospitalized (equation 26) depends on the effective number of beds and number of occupied beds. The fraction of community cases hospitalized (equation 27) depends on the effective number of beds and number of occupied beds including health care workers hospitalized, as health care workers are prioritized to maximize health care capacity. 0.001 is added to the size of the respective infectious compartments to prevent dividing the numerator by zero, in the case that there are no infected individuals.
The number of individuals subject to contact tracing (N_CT) depends on effective health care capacity, the number of people already hospitalized, and the number of available health care workers. As N_CT can never be less than zero, the maximum of the two values listed is taken as its value (equation 28.)
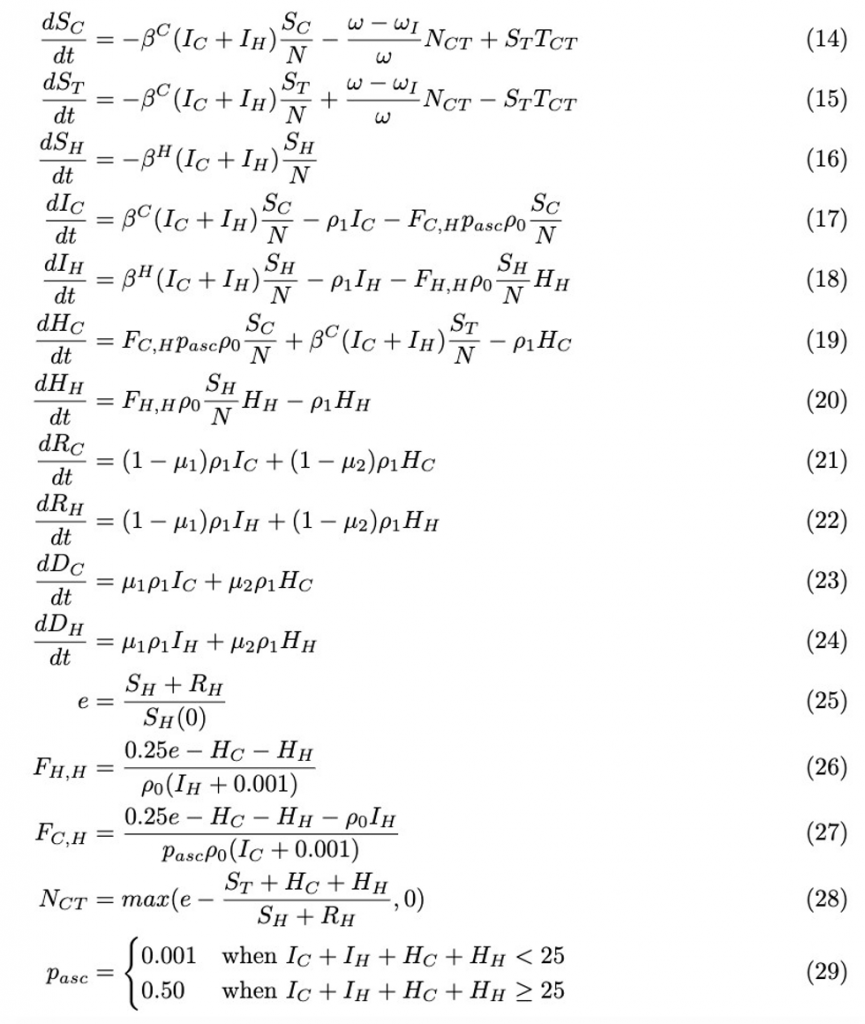
Results
Simulations of all 3 models were conducted in MATLAB and data was collected regarding the short- and long-term behaviors of the systems.
The pandemic was determined to be over, yielding data for the length of the pandemic and the total deceased individuals in each compartment, once the number of infected community members asymptotically approached a constant (determined visually).
Percentages are included for population numbers in Table 6, as the number of initial health care workers and community members varies between rural and urban areas.
Table 6: Summary of Results Across All 3 Models.
From Table 6, the length of the pandemic was decreased in the urbanization models compared to the rural across all 3 interventions, with the longest pandemics occurring in lockdown and contact tracing simulations (models 2 and 3.) However, urbanized areas also consistently saw higher death totals of both health care workers and community members, as well as a higher numbers of infected individuals at the pandemic’s peaks.
Model 1, modeling vaccination, yielded the highest number of infected community members and lowest number of infected health care workers at one time (for both rural and urban regions) in comparison to models 2 and 3, while model 2, modeling lockdowns, yielded the highest number of infected health care workers at one time. The highest death totals of both urban and rural health care workers and community members were seen in model 3, representing the effects of contact tracing, and the lowest in model 1.
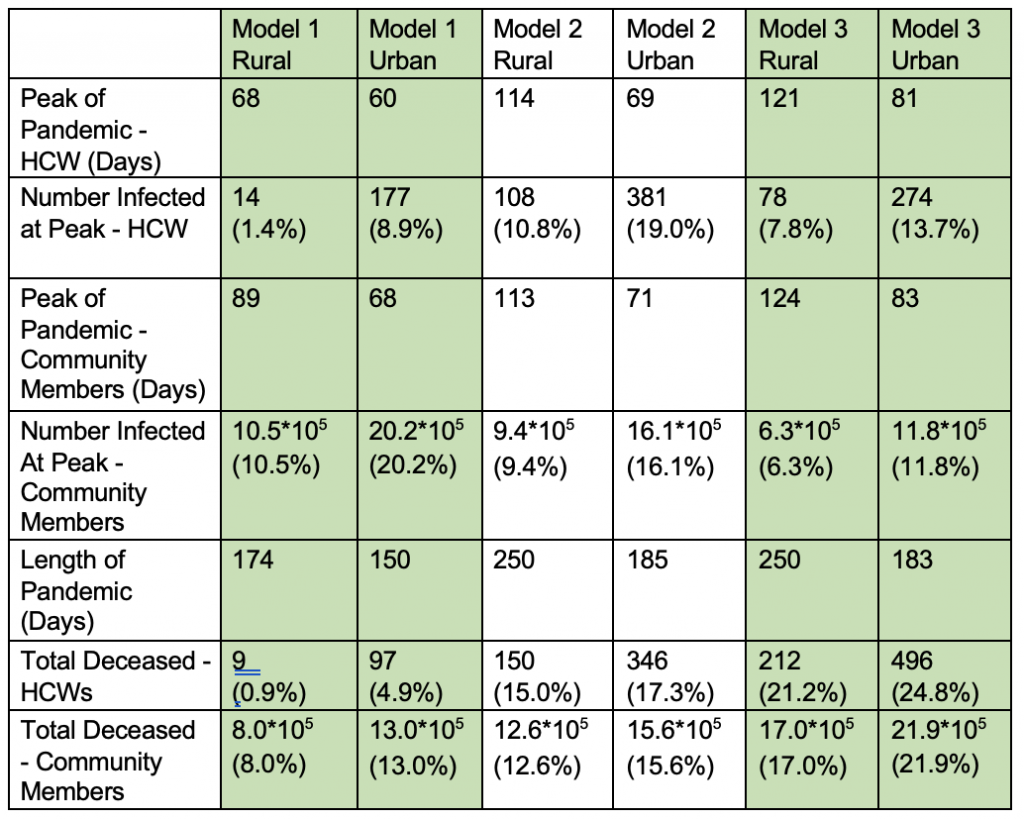
In model 2, a small bump can be seen in the graph of rural infected community members over time at the 50-day mark (Figure 4), visually representing the enforcement of the lockdown at t_Lockdown= 50.
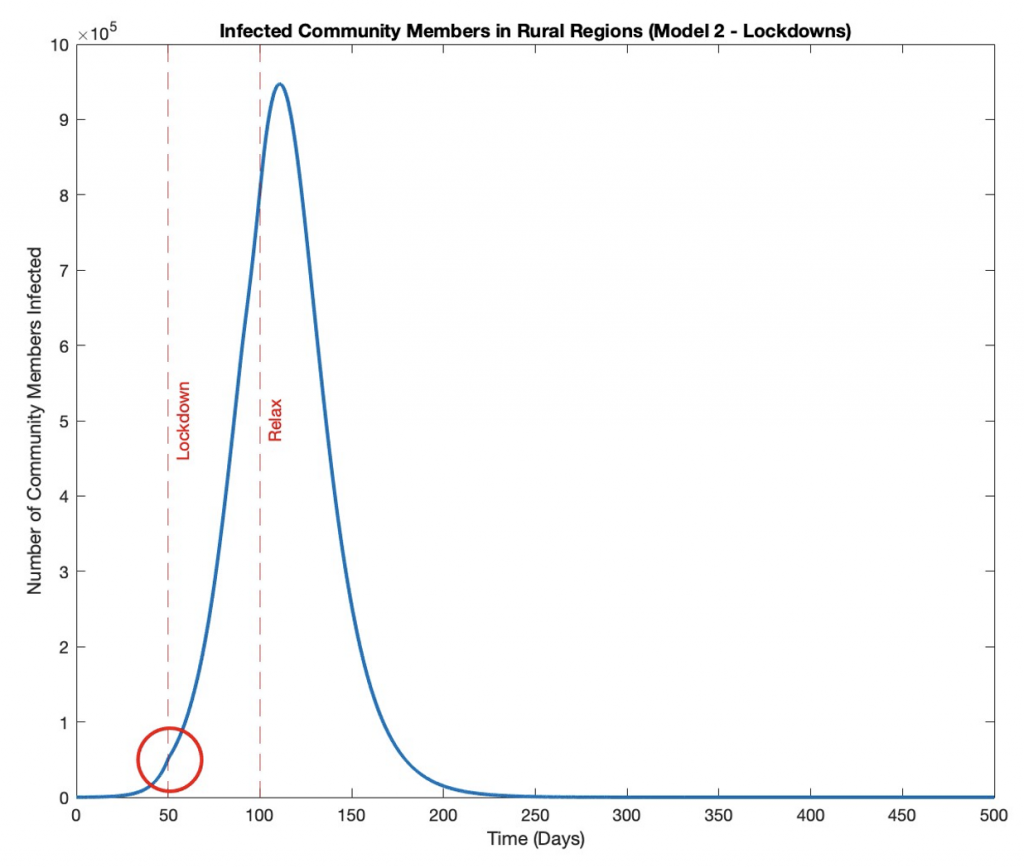
Figure 4: Infected Rural Community Members Over Time with Lockdown.
Health care workers hospitalized in both rural and urban regions for model 3 (contact tracing) remains at zero over the course of the pandemic (Figure 5). Zero is a steady state for the system and equation 20 always equals zero, as the number of hospitalized health care workers never changes from its initial value.
Figure 5: Hospitalized Rural and Urban Health Care Workers Over Time with Contact Tracing.
Discussion
This paper aimed to use mathematical models to find the impact of urbanization and interventions including vaccines, lockdowns, and contact tracing on pandemics. Results show that urbanization consistently shortens the pandemic, but also increases its intensity in both death count and the maximum number of infected health care workers or community members at one time.
A higher number of infected individuals at the pandemic’s peak is an undesirable outcome as this presents a significant strain on limited health care resources such as hospital beds or isolation units, ultimately exacerbating disease spread and death counts. These conclusions reinforce previous research that found overall higher adult mortality rates in urban sub-Saharan Africa compared to its rural counterpart, with an urban to rural probability of dying ratio of 1.08 for females and 1.11 for males (Menashe Oren & Stecklov, 2018).
While the first model on vaccination produced the highest number of infected community members at one time, it also produced the lowest number of infected health care workers at one time, providing a potential explanation for the model’s low death counts. A greater number of available health care workers would be able to combat an otherwise overwhelmed health care system and can better treat infected individuals, reducing the number of individuals entering the deceased compartments. This suggests health care workers should be greatly prioritized to minimize death in a population.
The highest number of infected health care workers at one time was seen in the second model. Death totals from this lockdown model were greater than in the first model, but less than that of model 3, suggesting a balance should be reached between prioritizing community members and health care workers when making decisions limited by resources to minimize death.
In the third model, a consistent number of zero health care workers were hospitalized in both urban and rural locations, suggesting that there are always enough available (susceptible and recovered) health care workers such that the number of hospitalized workers is never large enough to be sustained over time.
The models designed in this study rely on several simplifications. In particular, the models do not incorporate variable susceptibility of individuals as an SIR-type model, interaction between rural and urban communities, hand washing and face masking, and disease transmission involving separate vectors or sources such as mosquitoes or contaminated waterways. Additional variables may be present, such as cultural or community gatherings leading to increased human contact, even in sparsely populated rural areas. After these factors have been considered to provide a more comprehensive picture of disease spread over time, simulations should be conducted involving realistic time and resource interventions, guided by past case studies.
This study demonstrates the ability of mathematical models to provide important information to decision makers regarding the most effective and timely interventions to combat health crises, especially in the absence of significant certainty about disease spread. Future research should model the effect of interventions imposed simultaneously as opposed to in isolation and conduct correlation tests against past pandemic data. A strong correlation would provide evidence for an accurate model, strengthening the validity of future predictions generated from the model.
References
Ameyaw, E. K., Kareem, Y. O., Ahinkorah, B. O., Seidu, A.-A., & Yaya, S. (2021). Decomposing the rural–urban gap in factors associated with childhood immunisation in sub-Saharan Africa: Evidence from surveys in 23 countries. BMJ Global Health, 6(1), e003773. https://doi.org/10.1136/bmjgh-2020-003773
Bai, X., Nath, I., Capon, A., Hasan, N., & Jaron, D. (2012). Health and wellbeing in the changing urban environment: Complex challenges, scientific responses, and the way forward. Current Opinion in Environmental Sustainability, 4(4), 465–472. https://doi.org/10.1016/j.cosust.2012.09.009
Campbell, J. (2018, September 12). Africa is the Fastest Urbanizing Place on the Planet. Council on Foreign Relations. https://www.cfr.org/blog/africa-fastesturbanizing-place-planet
Chretien, J.-P., Riley, S., & George, D. B. (2015). Mathematical modeling of the West Africa Ebola epidemic. ELife, 4, e09186. https://doi.org/10.7554/eLife.09186
Dyson, T. (2003). HIV/AIDS and Urbanization. Population and Development Review, 29(3), 427–442. https://doi.org/10.1111/j.1728-4457.2003.00427.x
Engebretsen, S., Engø-Monsen, K., Frigessi, A., & Blasio, B. F. de. (2019). A theoretical single-parameter model for urbanisation to study infectious disease spread and interventions. PLOS Computational Biology, 15(3), e1006879. https://doi.org/10.1371/journal.pcbi.1006879
Hill Equation—Interactive Graph. (2014, October 22). https://www.physiologyweb.com/calculators/hill_equation_interactive_graph.html
Khedher, N. ben, Kolsi, L., & Alsaif, H. (2021). A multi-stage SEIR model to predict the potential of a new COVID-19 wave in KSA after lifting all travel restrictions. Alexandria Engineering Journal, 60(4), 3965–3974. https://doi.org/10.1016/j.aej.2021.02.058
Menashe Oren, A., & Stecklov, G. (2018). Urban–rural disparities in adult mortality in sub-Saharan Africa. Demographic Research, 39, 136–176. https://doi.org/10.4054/DemRes.2018.39.5
Moss, R., Hickson, R. I., McVernon, J., McCaw, J. M., Hort, K., Black, J., Madden, J. R., Tran, N. H., McBryde, E. S., & Geard, N. (2016). Model-Informed Risk Assessment and Decision Making for an Emerging Infectious Disease in the Asia-Pacific Region. PLOS Neglected Tropical Diseases, 10(9), e0005018. https://doi.org/10.1371/journal.pntd.0005018
Neiderud, C.-J. (2015). How urbanization affects the epidemiology of emerging infectious diseases. Infection Ecology & Epidemiology, 5, 10.3402/iee.v5.27060. https://doi.org/10.3402/iee.v5.27060
Rural Healthcare Workforce. (2020, September 11). https://www.ruralhealthinfo.org/topics/health-care-workforce
Tuite, A. R., Fisman, D. N., & Greer, A. L. (2020). Mathematical modelling of COVID-19 transmission and mitigation strategies in the population of Ontario, Canada. CMAJ, 192(19), E497–E505. https://doi.org/10.1503/cmaj.200476
Wilder-Smith, A., & Monath, T. P. (2017). Responding to the threat of urban yellow fever outbreaks. The Lancet Infectious Diseases, 17(3), 248–250. https://doi.org/10.1016/S1473-3099(16)30588-6
World Bank. (2017). Physicians (per 1,000 people)—Sub-Saharan Africa | Data.https://data.worldbank.org/indicator/SH.MED.PHYS.ZS?locations=ZG