Athena Cai, Year 3
Abstract
Machine learning through the SINDy approach has the potential to discover governing differential equations of highly complex fluid dynamics systems. This approach was applied to the combustion reaction that occurs when a lit match is dropped into a jug with its inner surfaces coated in isopropyl alcohol for the purpose of modelling the resulting motion patterns. Raw footage was captured of the system to be processed into POD modes, which provided training data for the algorithm. The final differential equations were plotted for visualization to successfully describe the system.
Introduction
Because our existence lies within the fluids that constitute our atmosphere and our water, fluid dynamics is easily applicable to a variety of fields. However, the reduction, modeling, and control of fluid dynamics systems is extremely difficult because these systems are high-dimensional, non-convex, multiscale, and governed by nonlinear formulae. Machine learning has the potential to bypass these optimization problems and find models that are sparse, low-dimensional, and robust. (Brunton, 2021).
Professor S. Brunton at the University of Washington developed a machine learning process known as the Sparse Identification of Non-linear Dynamics (SINDy). This is a generalized linear regression process using sparse regression to determine and concatenate the best set of terms and coefficients to discover parsimonious differential equations governing high-dimensional data, such as fluid flows. I decided to apply SINDy to the combustion reaction that occurs when a lit match is dropped into a jug with its inner surfaces coated in isopropyl alcohol. This system was chosen after first being observed as a chemistry course demonstration. The tumultuous and chaotic patterns had sparked intrigue. The intent of this investigation was to obtain a set of accurate differential equations describing the unique
dynamics of the combustion. A successfully obtained set could then be used to model, characterize, and predict the motion. Furthermore, modelling through equations had the advantage of plotting over time, which would describe the system in better detail.
The disturbance of gaseous flow caused by combustion is unique, in that it is an ongoing reaction changing the chemical composition, pressure, and temperature of the gas. The increased temperature brought by the combustion causes increased pressure as gases expand rapidly, as per the Ideal Gas Law. Rapid expansion causes explosive combustion, affecting the gas nearby. (Afework et al., 2018)
A Brief Introduction to SINDy
SINDy considers dynamical systems of the form

The vector 𝑥(𝑡) ∈ ℝ𝑛 denotes the state of a system at time 𝑡, and the function 𝑓(𝑥(𝑡)) represents the dynamic constraints that define the equations of motion of the. The function 𝑓 is typically comprised of a few terms of and their coefficients.
To determine the function 𝑓 from data, a time history of the state 𝑥(𝑡) is collected to numerically approximate the derivative 𝑥’(𝑡). The data is sampled over a time series of several steps 𝑡1, 𝑡2, ⋯ , 𝑡𝑚-1, 𝑡𝑚 and arranged into two matrices 𝑋 and 𝑋̇. Next, a library 𝛩(𝑋) is created consisting of candidate nonlinear functions of the columns of 𝑋. This library 𝛩(𝑋) may consist of constant, polynomial, and trigonometric terms. The terms used in this investigation were restricted to polynomials up to the fifth degree. Each column of 𝛩(𝑋) represents a candidate function 𝑓. (Brunton et al., 2016) There is tremendous freedom in choosing the entries in this matrix of nonlinearities. A sparse regression problem is set up to determine the sparse vectors of coefficients 𝛯 = [𝜉1𝜉2 ⋯ 𝜉𝑛] that determine which
nonlinearities are active:

A Sequential Threshold Least Squares algorithm is used to determine the candidate terms in 𝛯. First, the algorithm uses a least squares regression, where a 𝛯 is output with a little bit of all candidate terms. Some terms will be very small. These small terms are cleared when they do not meet a threshold. Another least squares regression is applied to the remaining coefficients, causing some of those to become small again to reintroduce the threshold. This procedure is applied iteratively until the model converges. This algorithm balances sparsity and a well-fitting model. This is controlled by a parameter 𝜆, where a larger value increases the significance of sparsity and ‖𝛯‖ is the dominant term. A smaller parameter 𝜆 gives less weight to sparsity, where a well-fitted model of less error is more important. (Kaiser et al., 2018)

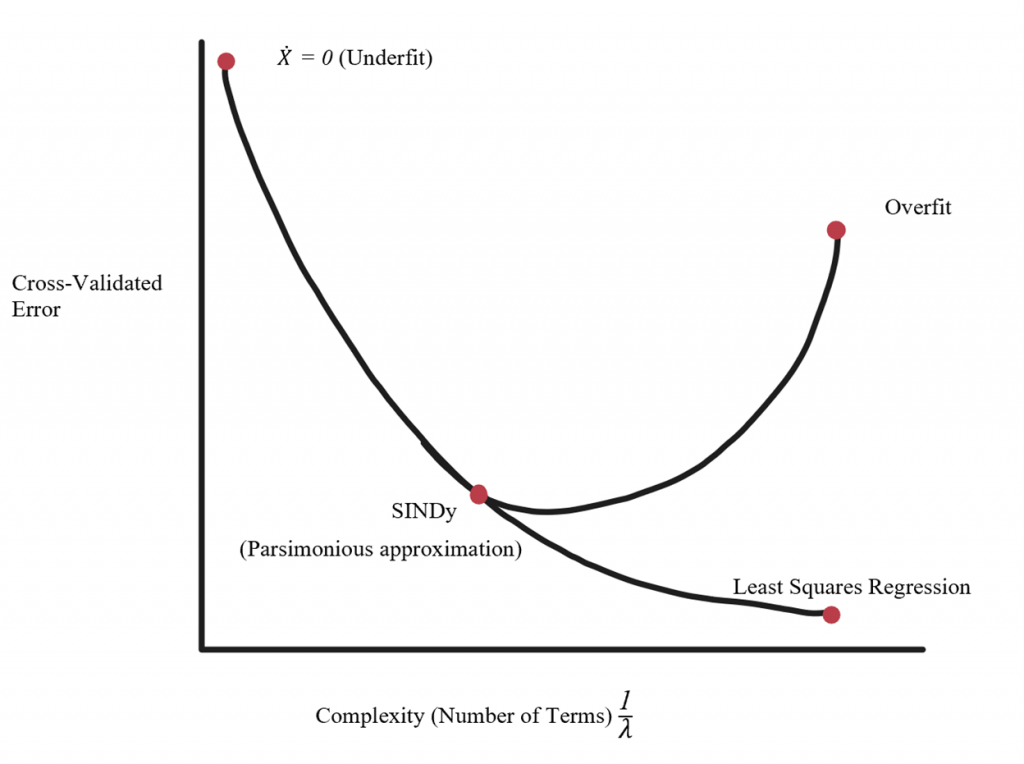
Figure 1: Pareto Curve
The Pareto curve illustrates the relationship between complexity and accuracy of governing differential equations and the approaches to obtain varying degrees of either variable. When unfamiliar with the physics of a system and the governing equation is unknown, it is a good idea to get a handful of models with varying 𝜆 to obtain 2-4 points on the Pareto curve. These models can be compared to see which terms are included or excluded between equations of varying complexity.
Materials and Methods
¼ cup of 99% Isopropyl Alcohol (Pure Standard Products) was poured into a 5-gallon water jug. The jug was then rotated so that the alcohol coated all interior surfaces as much as possible. The jug was then taped to the ground in front of a black background. All sources of light were removed, and a match was lit, then dropped in the bottle. An iPhone XS (Apple) was placed to face the jug and record the combustion action in slow motion at 180fps.

Figure 2: Footage Processing Through Premiere Pro
The footage of each trial was then processed using Adobe Premiere Pro (Figure 2) to provide ideal data to train the SINDy algorithm with. The clips were cropped to only show the frames where there is light from combustion. Then the free draw Bezier tool under the opacity section of video effects was used to outline the jug and create a mask so that all pixels outside the outline of the jug remained black and were not captured to minimize training data noise. Finally, using the Brightness & Contrast effect, the brightness of the footage was dialed to -80 while the contrast was set to 10 to heighten the contrast between light and dark pixels to highlight patterns of flows. Finally, the Colour Balance (HLS) tool was used to set Saturation to -100 to create a black and white clip because the only data the algorithm needed to work with was the brightness of each pixel. Calling upon hex values of black and white footage to obtain brightness is more efficient than using colour, where the average of the red, green, and blue values would be calculated.

Figure 3: OpenCV Footage Processing
Next the hex values of each pixel were obtained by processing footage using OpenCV through Python in Visual Studio Code (Figure 3). The number of frames in each video as well as the dimensions of each frame were determined. To reduce data matrix file size, the average brightness value of every 4 pixels was taken. Next the data was exported as a matrix ‘A.mat’ file where each row is the averaged pixels of one frame, time increases going down the rows. The ‘A.mat’ file was imported in MATLAB. The values in the matrix were converted from the double type to the single type to reduce bitesize by half using the single function. The matrix was transposed so that time is along the x axis rather than the y axis using the transpose function.
Proper Orthogonal Decomposition (POD) is a technique also known as Principal Components Analysis, which determines the eigen vectors of a set of data. These eigen vectors or POD modes describe the highest modes of energy. The first modes are the best at describing the dynamics and contain the most energy, while subsequent modes are less significant and can be ignored when adding modes to reconstruct the motion. To find an eigen vectors, the data is plotted, then centered around the origin. The best fit line of the data is found using the maximum sum of squares method, where the squared distances from each point its relative projected point on the line is squared and added. The line obtaining the maximum sum is the best fit. The slope of this line becomes the new unit, and is then the eigen vector, best describing the data. In a data set with only two dimensions, the second eigen vector or second POD mode is simply perpendicular to the first. However, if there are three dimensions, the second eigen vector must also be found using the maximum sum of squares method. The third vector would be perpendicular to both other vectors. This same process can be applied to data of several higher degrees. The data in this investigation
and the investigation of other fluid flows captured by 2D video has a degree determined by the number of pixels in each frame. (Zigunov, 2021)

Figure 4: Singular Value Decomposition with MATLAB
Using Singular Value Decomposition to find the POD modes, an 𝐴 matrix where all the pixels of each frame are lined up in one column each and the x axis is defined by the time series is deconstructed into the matrix 𝑈, where each column defines a POD mode, the S matrix, which defines the significance of each mode in 𝑈, and the 𝑉 matrix, which is transposed to describe. MATLAB’s svd function (Figure 4) compresses this entire process into one line of code. All that is required is proper pre-processing to obtain an input 𝐴 matrix that fits the storage limits of the function. The singular value decomposition function was used to determine the 𝑈, 𝑉, and 𝑆 matrices for the proper orthogonal decomposition modes. The first three columns or POD modes of the 𝑈 matrix was extracted to be as a coefficient’s matrix ‘coefficients.mat’ of three columns. These three columns can be visualized by deconstructing each column and using the values as an input for the brightness of each pixel. These values were plotted as pixels using the matplotlib scatter plot functions (Figure 5).

Figure 5: POD Modes Visualization Code
Finally, the coefficients matrix ‘coefficients.mat’ was used to train PySINDy (Figure 6), a Pythonpackage for SINDy implementation. To set up the file, the libraries were imported, and the integrator keywords were defined. The coefficients matrix was imported and timesteps were created for each row of the matrix using the frame step size of the footage. This was calculated by dividing the number of frames by the number of seconds spanned by the footage. This was calculated to be approximately 0.03 seconds. All five trials were processed in the same way and referred to as x_run1 to x_run5. The output of the code are the governing differential equations. Using the matplotlib python library, the equations can be used to plot and visualize a simulation of the original system.

Figure 6: PySINDy Implementation
Results
The following table compares processed and unprocessed frames of one set of test data footage. There frames were chosen having been identified as identifiable and significant stages in the short process. The stages were identified after observing several trials of the combustion over multiple data sets.
Table 1: Stages of combustion from one data set
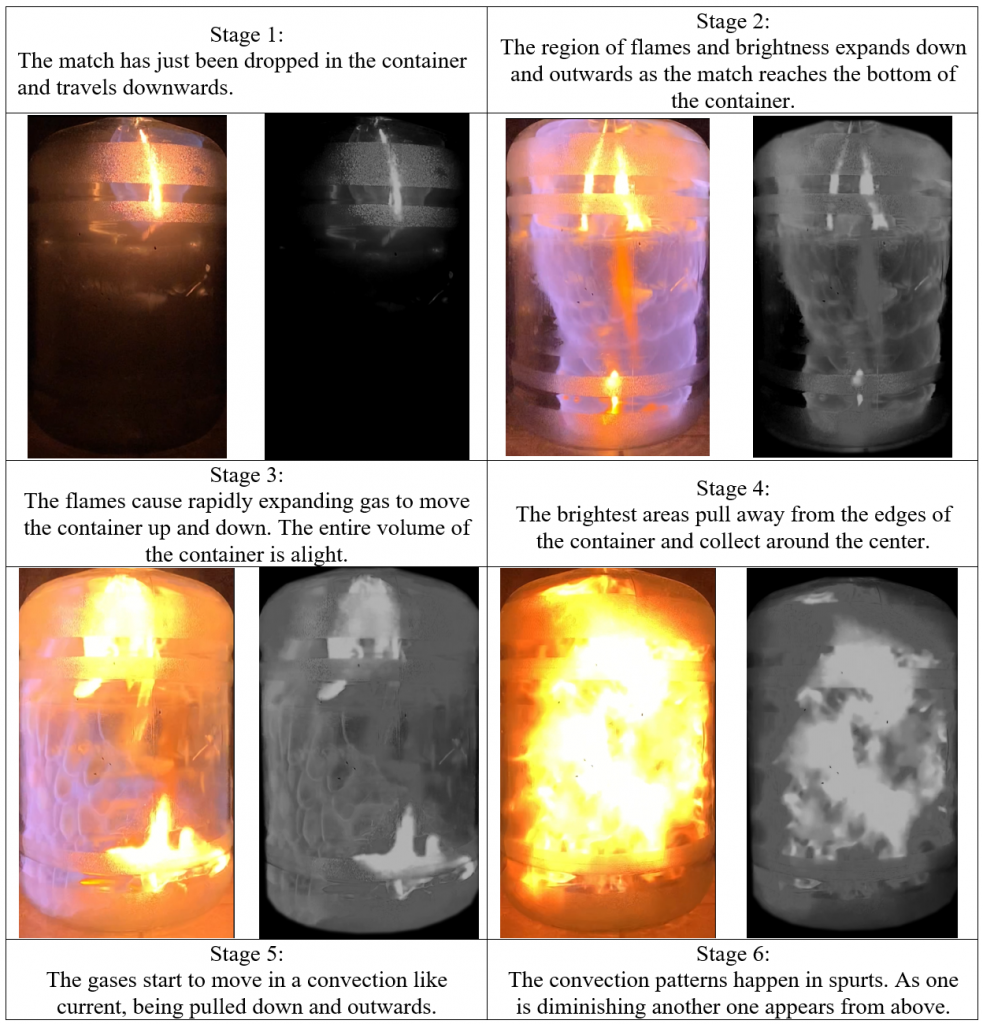
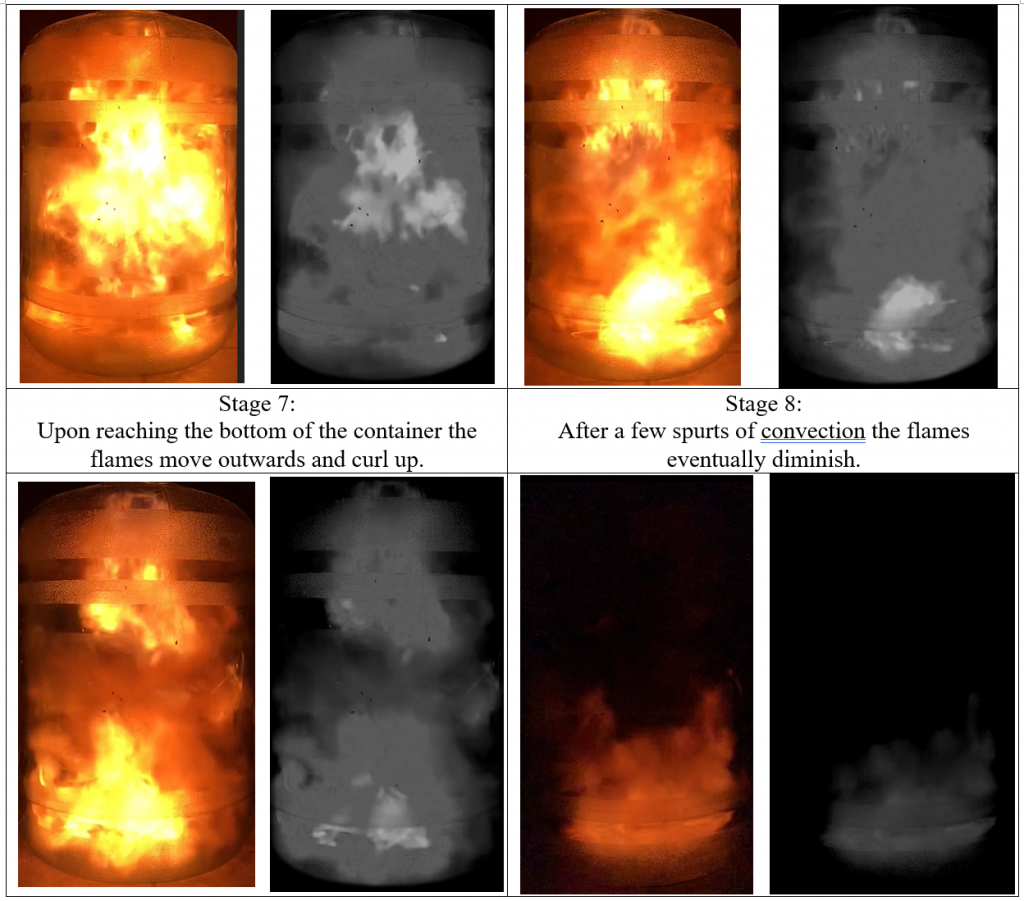
Stages 5-7 last longer when more fuel is in the container, there are more cycles of convection. Figures 7-9 present the three POD modes used as input in PySINDy for analysis. POD Mode 1 captures the most prominent motion of the system. The motion captured by POD Modes 2 and 3 is also significant, but less so than Mode 1. The pixel data of the three POD Modes was used as training data for the SINDy algorithm. Thus, by visualizing the data we can see where the output system of differential equations came from. The blue pixels portray the position of the flames in the high energy motion. Red pixels indicate areas of less flame.

Figure 7: Visualized POD Mode 1

Figure 8: Visualized POD Mode 2

Figure 9: Visualized POD Mode 3
Output of nonlinear differential equations, where the 𝑍 axis is time:

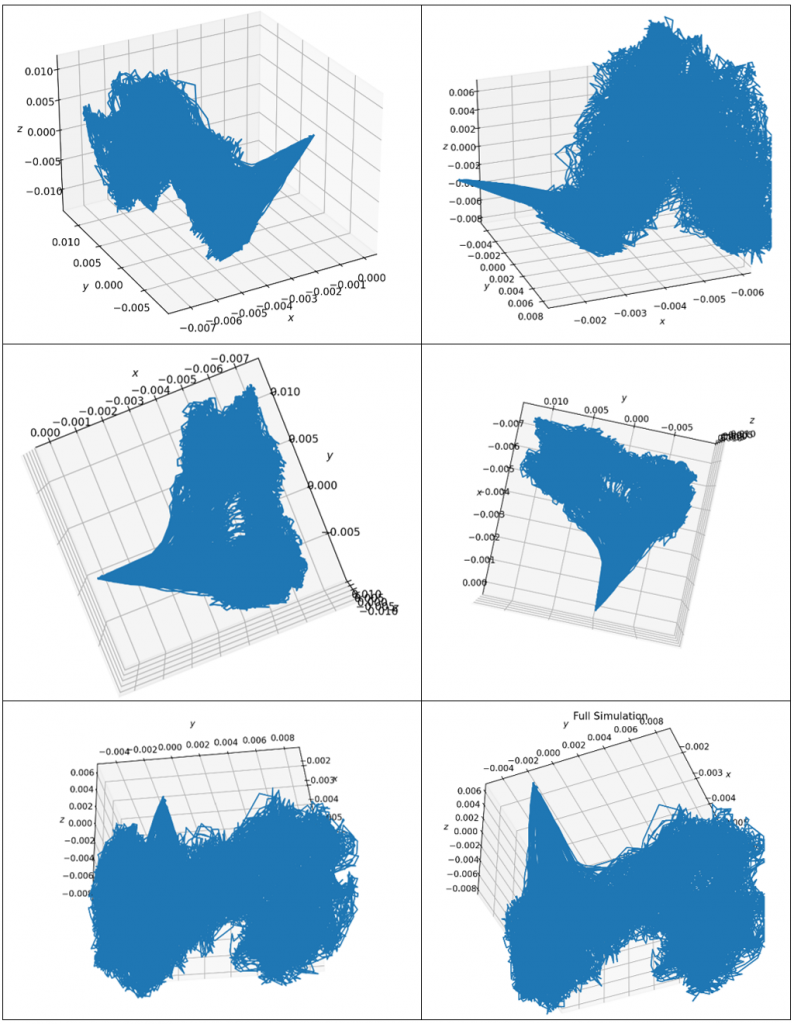
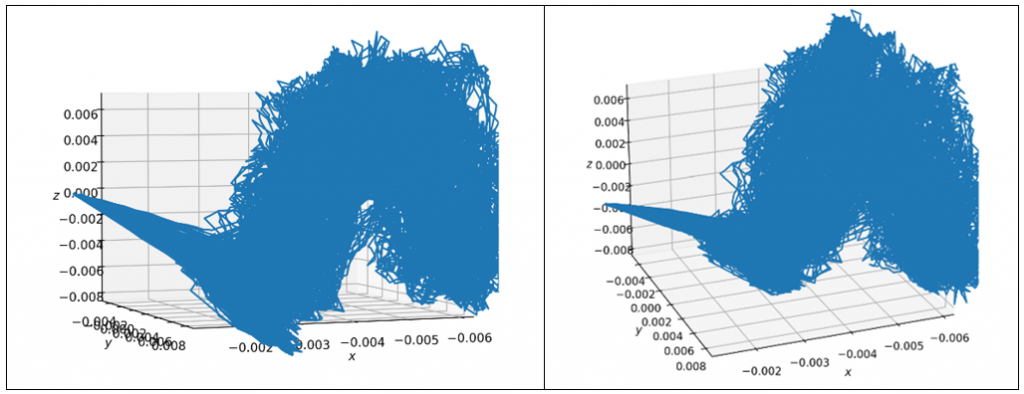
The differential equations were plotted for visualization. Different angles of this plot are shown in Table 2. The blue plot pertains to flame location. The 𝑋′ and 𝑌′ axis describe the flame dynamics plotted over time in the 𝑍′ axis.
Table 2: Visualized simulation plot
Discussion
The set of differential equations consists of linear and quadratic terms in all three dimensions 𝑋′, 𝑌′, 𝑍′. Geometrically, quadratic terms describe parabolic shapes. Thus, through a rudimentary lens of geometrical interpretation, the set of equations seems to describe motion that is parabolic and linear.
At first glance, the different angles in Table 2 of the visualization of the differential equations seemed random and insignificant to the system. However, the shape makes more sense when analyzed with reference to the stages of combustion described in Table 1.
First, the protruding wedge represents the dropped match at the beginning of the time frame. This statement is supported by the observed lack of lines in the same area of the x and y axis as the z axis increases. The triangular shape of the wedge mirrors stage 1, indicating a brightness that grows wider in the x axis as it moves along the y axis. These flames disappear shortly afterwards as indicated by the increase in the z axis. The base of the plot is in the shape of a U because initially, there is no flame at the bottom of the container, creating a hole. With an increase in the x axis, the flames are more concentrated near the bottom of the container, as indicated by the clump of lines. Unfortunately, the convection patterns observed in Stages 5-7 are indiscernible from the rest of the graph.
The patterns in the POD modes in Figures 5-7 were also unexpected, with the container of the first POD mode (Figure 5) being completely illuminated. This image is reminiscent of Stage 3. As the first POD mode is supposed to represent the most energy in a system, this result does not seem outlandish. The second POD (Figure 6) mode describes how most of the flames were concentrated along the bottom of the container. The third mode (Figure 7) is unclear but seems to depict a concentration of energy along the sides of the container, possibly in the shape of the convection currents. As the PySINDy input, the accuracy of the POD modes is extremely important. While the modes are difficult to explain, this does not make the modes inaccurate. Additionally, the explanations I have provided are based on subjective observation. Comparison between trials of POD modes and accurate SINDy results are better sources of affirmation.
By training a PySINDy algorithm using POD modes of raw data footage, I was able to create a model of a complex and dynamic combustion system. This model is described by a sparse set of differential equations that can be plotted for visualization.
References
An introduction to Sparse Identification of Nonlinear Dynamical systems (SINDy)—Pysindy 1.6.4.dev4+ga63ffcf documentation. (n.d.). Retrieved from
https://pysindy.readthedocs.io/en/latest/examples/2_introduction_to_sindy.html
Discovering governing equations from data by sparse identification of nonlinear dynamical systems. (n.d.). PNAS. Retrieved from https://www.pnas.org/doi/abs/10.1073/pnas.1517384113
Internal combustion engine—Energy Education. (n.d.). Retrieved from
https://energyeducation.ca/encyclopedia/Internal_combustion_engine# :~:text=Internal%20combustion%20heat%20engines%20work%20on%20the %20principle,order%20to%20raise%20the%20temperature%20of%20the%20gas.
Kaiser, E., Kutz, J. N., & Brunton, S. L. (2018). Sparse identification of nonlinear dynamics for model predictive control in the low-data limit. Proceedings of the Royal Society A: Mathematical, Physical and
Engineering Sciences, 474(2219), 20180335. https://doi.org/10.1098/rspa.2018.0335
Original Paper: Sparse Identification of Nonlinear Dynamical systems (SINDy)—Pysindy 1.6.4.dev4+ga63ffcf documentation. (n.d.). Retrieved from
https://pysindy.readthedocs.io/en/latest/examples/3_original_paper.html
Sparse Identification of Nonlinear Dynamics (SINDy): Sparse Machine Learning Models 5 Years Later! (n.d.). Retrieved from https://www.youtube.com/watch?v=NxAn0oglMVw
Sparse Nonlinear Dynamics Models with SINDy, Part 5: The Optimization Algorithms. (n.d.). Retrieved from https://www.youtube.com/watch?v=pY2iJnngk4g
Understanding pod: The proper orthogonal decomposition #3b1b. (n.d.). Retrieved from https://www.youtube.com/watch?v=axfUYYNd-4Y