Diana Urbanczyk, Year 2 Engineering
Abstract
Thermoelectric generators (TEGs) are being explored as yet another source for sustainable energy with their curious method of producing electricity. By taking advantage of a temperature differential, electricity is created that can then be used to power electrical components. Therefore, this project explores whether it is possible to reach a useful voltage output using solely TEGs and varieties of situations. Only attaching three TEG tiles to an aluminum bar with thermal paste and creating a box-like tube, the design was kept simple to explore the efficiency of a TEG system. Although enough voltage was produced to light an LED, the results imply that a system without a power bank would need to be larger to provide steady power. Overall, this project is a proof of concept for systems using solely TEGs.
Introduction
The need for renewable energy sources leads to new ideas and research on methods of clean energy production. Recently, thermoelectric generators (TEGs) experienced an increase in popularity–the thermoelectric generator market is forecasted to reach $1443.3 USD by 2030 (Mandon and Prasad 2021). TEGs are solid state devices that convert temperature differentials directly into electricity. Through the application of a heat source and heat sink, electricity is created and utilized (Jaziri et al 2019). Most projects that have TEGs as a power source also include many other components to increase the power output of the tiles, namely power banks. While this may aid in accomplishing the goals of the project, it also increases the complexity to a point where beginners in the field may not feel comfortable to experiment and explore how these tiles can be used. Exploring how efficient TEGs can be on their own can also provide insight on how useful a simple system can be in small and straightforward applications.
This project aims to explore the efficacy of thermoelectric generator tiles without any other additions into the circuit. Mainly, whether it would be possible to create a hand held circuit with TEGs for long term, low power applications. A well known example of work already done in this field include Ann Makosinski’s “Hollow Flashlight”: a flashlight powered by the heat of your hand (Hollow Flashlight 2015). This is the main inspiration behind this project, as the circuit Makosinski used contains more than just TEGs, and it was only to power an LED. The objective of the design in this paper is to see if the same result can be achieved with nothing but a set of TEGs, and to conduct a variety of situational testing for the system. The end product was a hollow rectangular prism made up of four aluminum walls with three TEGs attached to the exterior of the top wall. The wires were kept free to facilitate testing and readings, but in a more finalized and professional project, they would be connected to the component needing to be powered.
Material and Methods
Three thermoelectric generator tiles were attached cold-side-down to a ⅛ inch thick, ~6 inch long aluminum bar using thermal paste (Arctic Silver Ceramique 2), as shown in Figure 1.
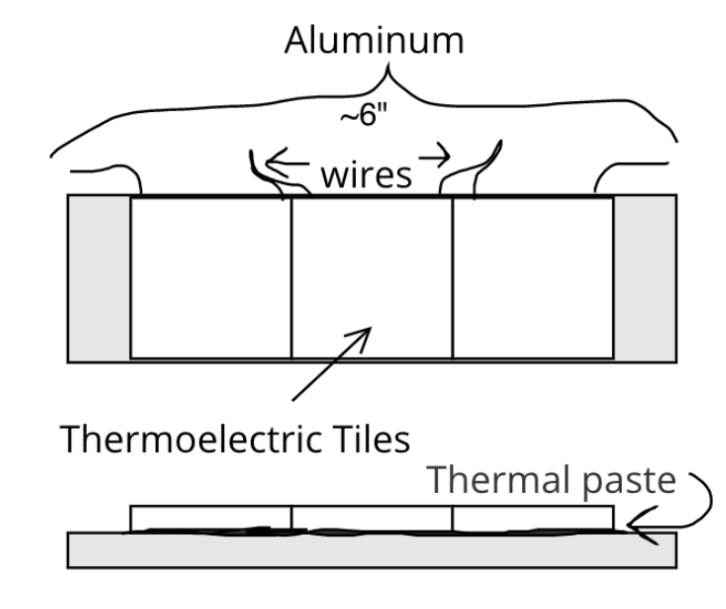
Figure 1: Birds eye and side view diagrams of tile layout on top aluminum bar
Beforehand, the wires of the tiles were cut and soldered together to create one closed circuit and add the output together, as shown in Figure 2. They were placed directly next to each other and left to set on the aluminum for a week. Certain tests were done immediately following the completion of this portion. After those experiments, three more bars of aluminum of roughly equal length were attached to create a box shape using JB Weld epoxy, which is demonstrated in Figure 3. The rest of the tests were done with this form. Figure 4 illustrates how the build was connected to the breadboard to power an LED in experiments. The method for testing was to first measure the temperature of the cold side of the tile (or of the object being applied), followed by measuring the temperature of the hot side (or of the object being applied). The temperatures were taken using an infrared thermometer. The most common procedure went as follows: Initial temperature was measured for the table (cold side) and the heat pack (hot side). Once the heat pack was applied, a voltmeter was used to measure the peak voltage produced. Each unique procedure was noted in the data collection. These different cases are noted in Table 1, including using ice and a heat pack simultaneously, and filling the build with ice and wrapping a hand around it (seen in Figure 6 and Figure 5 respectively). The difference of the initial temperatures was graphed against the voltage output of the system.

Figure 2: Wires of TEGs soldered together
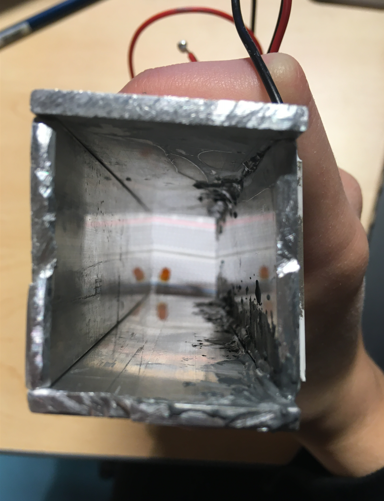
Figure 3: View through the center of the build (note that it is hollow)
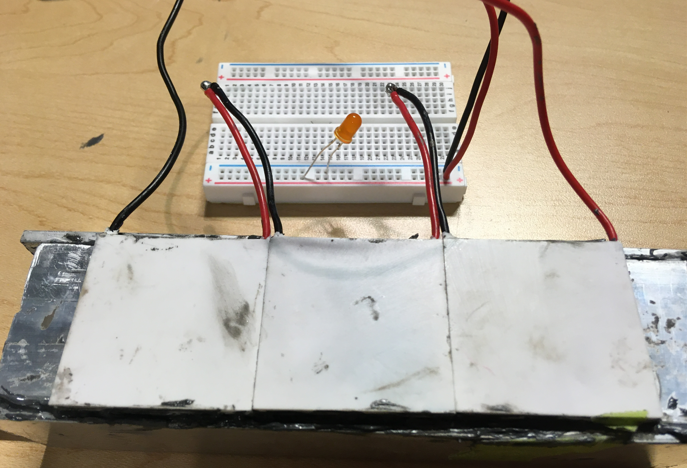
Figure 4: TEGs attached to aluminum with loose wires in the breadboard.
This was the set up often used to measure output.
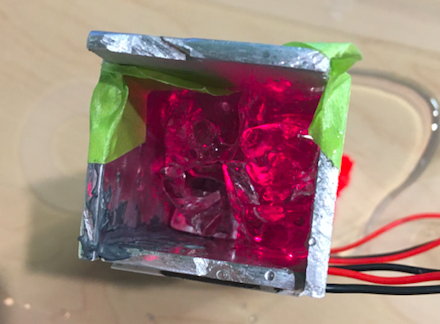
Figure 5: Photo of how the ice in tube experiment was conducted inside a plastic container with the contraption upright so that water could drain out and new ice be filled in.
Results
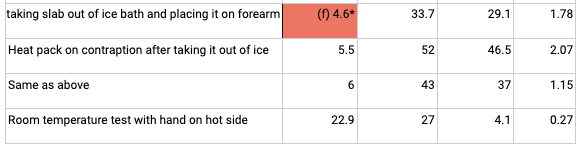
Table 1: Data collection over the course of the experiments. Temperature of each side is the temperature of what was applied to the side, or of the initial temperature of the tiles/aluminum when nothing was being applied. Situation description notes the main differences in procedure, and what case was replicated.
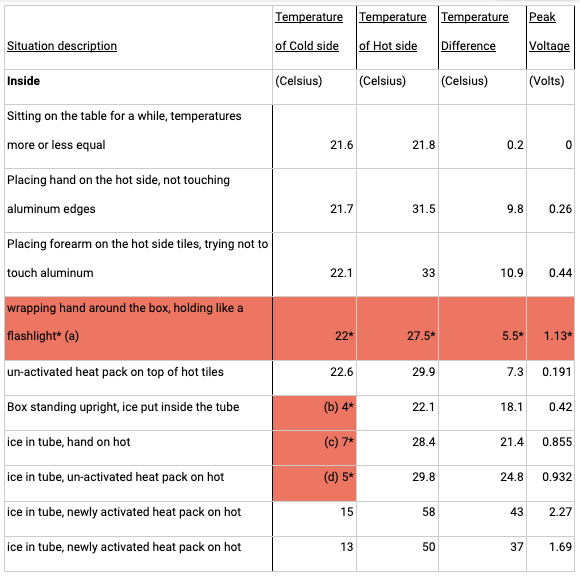
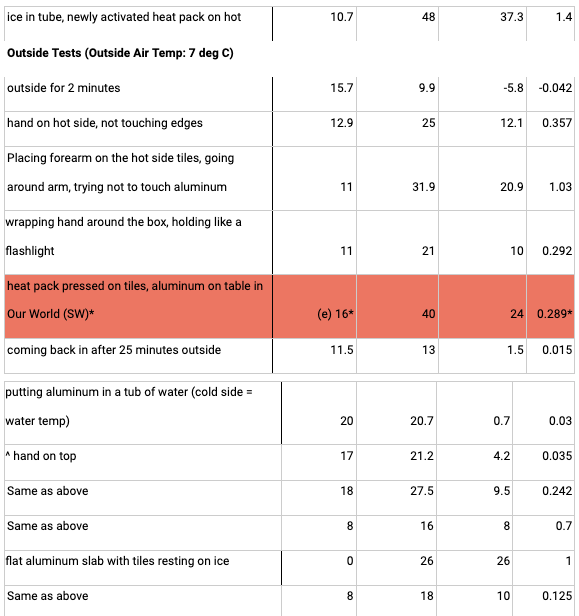
The red fill represent data that most likely gathered incorrectly (outliers and mistakes). Because of the uncertainty behind these values, one graph was made with them included (ALPHA) and one was made without (BRAVO) to see if these possible errors had significant effect on the results. More detail on the circumstances are provided in the results section below.
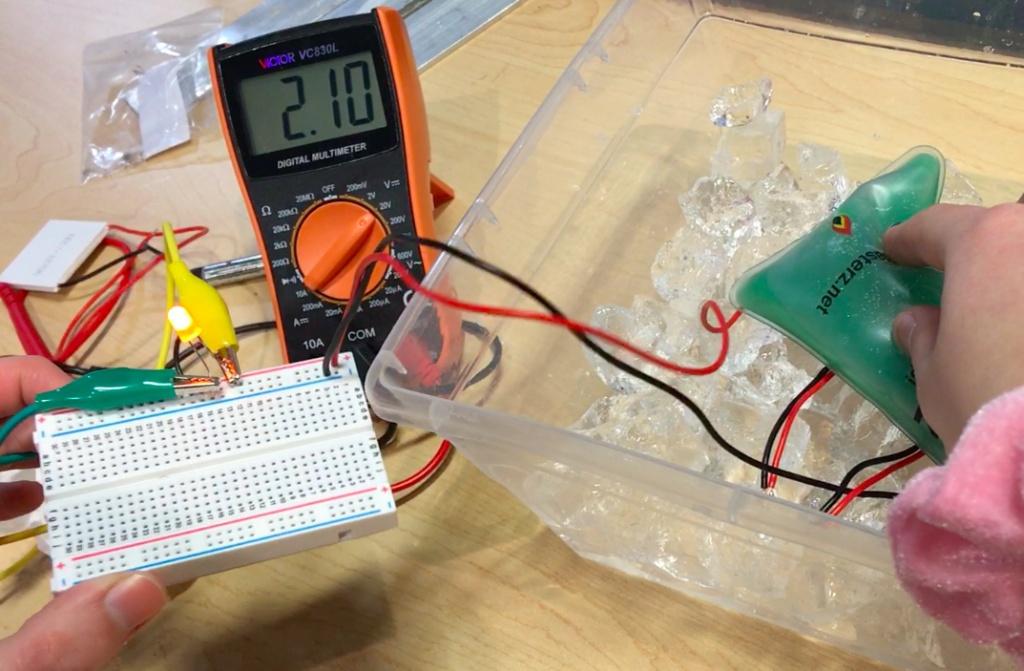
Figure 6: 2.10 volts produced by the tiles with ice on the cold side and a heat pack on the hot side. On the left an LED is glowing brightly as a result of the system.
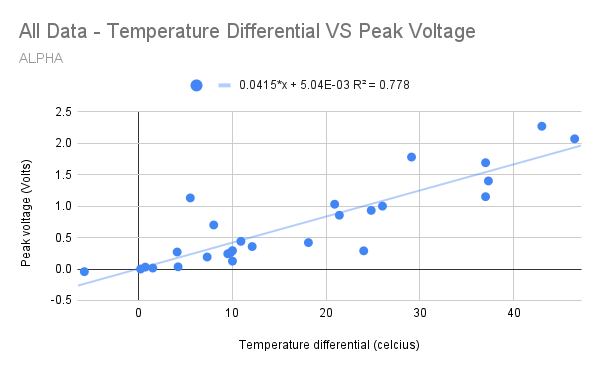
Figure 7: All collected data graphed (temperature differential against the peak voltage). A best fit line demonstrates a positive linear graph
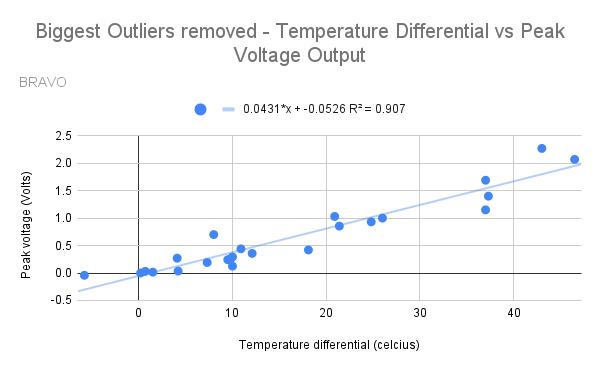
Figure 8: Data graphed with most erroneous data points removed (sections (a), (e ), and(f) on Table 1).
2.27 V was the highest output recorded, and it was achieved by applying ice and a 50°C+ heat pack to the system– an extreme case. The slope of the graphs represent voltage per degree Celsius. After removing three of the biggest outliers, the slope of the best fit line increased by 0.0016 and the R2 value increased by 0.129. Even with the outliers present, an upwards linear trend is present in the data. The highlighted row (a) in Table 1 was marked as erroneous because of the voltage recorded in the lab notes; it is extremely likely that it was written there in error, as it was a relatively large jump away from the previous readings, and seemed to be more in line with the measurements following that specific test. Sections (b) through (d)
and (f) were suspicious due to the way the temperature of the cold side was measured. When the infrared thermometer was pointed at ice, it would often be reflected, so there was a chance the readings were not accurate to what was being placed on the aluminum attached to the cold tiles. The cold side temperature in row (e) was taken earlier, and after the application of the heat pack, it changed quickly. The voltage reading was not taken down quick enough, and by that time the temperatures started to equalize, resulting in an abnormally low reading for such a temperature differential.
Discussion
The fact that the results demonstrate a positive correlation is reassuring, as the method of measuring temperature was not guaranteed to be effective in this experiment. The temperature measurements did not account for the change in temperature as an object is applied to the tiles. Measuring only what is applied does not account for the initial temperature of the tiles, which leads to inaccurate interpretations of temperature differentials. A future version of this project must decide on a consistent and precise way of measuring temperature to ensure accurate and reliable results. In addition, over the course of the experiment, the aluminum consistently defaults to a higher temperature than the ceramic of the tile when left to sit during the week between sessions. As a result, it would be useful to compare the power output when the aluminum is attached to the hot side of the tiles. The aluminum is also not enough of a cold sink and holds the heat applied to the hot side easier than expected, resulting in quicker balancing of temperatures (another reason why the power output could not be sustained for long).
This design is meant to explore how efficient thermoelectric tiles can be without any other additions to the circuit, like a powerbank. The results demonstrate that while it is possible to generate enough electricity to power very small components (LEDs), it is not a consistent output. Once the system reaches peak voltage output, output begins to fall steadily. A solution to this problem would be to use more tiles so that a higher peak voltage can be reached. As the temperature differential increases after the application of a heat source, electricity would be produced steadily enough for constant power– until the cold side heats up or the hot side cools down and equilibrium is reached. However, this is not the best solution as this method still has a time limit.
Although such a small scale project does not have many useful applications, it is a proof of concept to demonstrate that it is possible to reach a voltage output using solely thermoelectric tiles and hot and cold sources. While scaling up the project may decrease its portability, it would also ensure more power, so future work must strike a comfortable balance between the two.
References
“Hollow Flashlight | the Henry Ford’s Innovation Nation.” YouTube, TheHenryFord, 12 Jan. 2015, https://www.youtube.com/watch?v=RCWVIDwnplA&ab_channel=TheHenryFord.
Jaziri, Nesrine, et al. “A Comprehensive Review of Thermoelectric Generators: Technologies and Common Applications.” Energy Reports, Elsevier, 24 Dec. 2019,
https://www.sciencedirect.com/science/article/pii/S2352484719306997.
Mandon, Pratik, and Eswara Prasad. “Thermoelectric Generator Market Analysis -2030: By Material, Application.” Allied Market Research, Allied Market Research, Oct. 2021,
https://www.alliedmarketresearch.com/thermoelectric-generator-market.