Fifi Zhao, Year 2 Research
Abstract
Infographics are becoming ever-increasingly important in the transmission and collection of information, especially in the digital age. This study investigated adolescents’ evaluation of several infographics through an anonymous survey and asked them to rate their level of awareness and motivation for the social cause of food insecurity in BC. A second survey was conducted with a new infographic improved according to qualitative feedback given by the participants using the same evaluation metrics. The results suggest a positive relationship between the visual design quality of an infographic and its ability to inform adolescents; however, motivation is not affected and even decreases with poor visual design quality. This study also supports the idea that the visual aspects of an infographic are more influential than other factors such as organization of information.
Introduction
As the twenty-first century progresses, infographics have become very influential in our daily lives (Dick, 2016; Santos et al., 2018). Certain visualizations of data have become permanent fixtures in discussions surrounding climate change (Harold, 2016), the COVID-19 pandemic (Bernasconi, 2020), and many more pertinent global issues. Others have found their place in educational settings (Vanichvasin, 2013) and news platforms (De Haan et al., 2018).
In essence, an infographic is a graphic visual representation of data or knowledge aiming to inform an audience quickly and clearly (Siricharoen, 2013). It is meant to be easily understandable and transmittable, as well as provide a surface-level understanding of the subject (Siricharoen and Siricharoen, 2015). The history of infographics dates back to the eighteenth century when Scottish engineer and economist William Playfair was the first to develop the line chart, bar graph, and pie chart, among other statistical graphics (Spence, 2006). More recently, American statistician Edward Tufte’s research on the best practices for data visualisation have expanded our proficiency in using infographics to efficiently inform (Tufte, 2001). With the advent of the Internet and the explosive popularity of online platforms, governments (Siricharoen, 2015) and institutions (Ruini, 2016) are starting to modernize their informational campaigns to include infographics.
Previous research on infographics focuses mainly on its applications in the education sector (Bystrova, 2020) such as learning programming skills (Al-Mohammadi, 2017). Other research about the influence of infographics on public policy looks at the general population (Otten et al., 2015), as opposed to a specific subgroup like adolescents. Little research has been conducted specifically on teenagers’ attitudes towards social change as a whole. In addition to the commonly measured variable of information retention (Martin, 2019; Al Hosni, 2016), the study will also investigate changes in attitude towards a subject and inclination for action. Thus, the results can be easily applied to real-world situations that aim to influence individuals’ thinking and behavior.
Materials and Methods
In order to determine how to best use infographics to educate and motivate adolescents, this study measures the effects of different combinations of infographic variables on adolescents’ attitude towards a given topic. Previous studies have identified visuals and informative content as key components of infographics (Siricharoen and Siricharoen, 2015; Yildirim, 2016). The independent variables chosen to represent infographic quality include visual design and organization, while the operationalized dependent variables are the evaluation of the graphic, awareness of the topic, and motivation to act.
In this study, visual design describes the presentation of the information; an infographic with high quality visual design is defined as having a unified colour scheme, appropriate graphics, and strategic usage of font size. Organization indicates the logical flow of the infographic; a highly organized infographic is defined as having information organized in a reasonable order with appropriate headings for each section. Four infographics were created, each having a combination of low or high quality of visual design and organization. All the infographics contain the same information about the same topic, food insecurity in British Colombia, to eliminate confounding variables for different subjects. Additionally, the chosen topic is less well-known to the public so the effect of previous knowledge or exposure to the topic is minimized.
The 42 participants of this study were high school students of grades 8 to 12 in the Vancouver and its surrounding metropolitan area. Most of the participants were recruited within several different branches of the Future Science Leaders program, and the rest signed up through a social media post. There was a monetary incentive of a raffle draw for two $50 gift card prizes. The mean grade was 11 (SD = 0.84) and there were 32 females, 8 males, and 2 participants who did not disclose their gender identity.
The data was collected exclusively through anonymous online survey forms. Participants were asked to complete 2 Google forms with a 2-week break in between.
The participants were randomly assigned to one of three groups (Groups 1, 2, and 3). Group 1 received an infographic with poor visual design (see Appendix A), Group 2 received an infographic with poor organization (see Appendix B), and Group 3 received an infographic that was poor overall (see Appendix C). All groups were asked to compare their specific infographic with an “exemplary” infographic designed to have high quality visual design and organization (see Appendix D). Each group was counterbalanced to ensure that the order of the infographics presented was not a confounding variable.
In the first survey, demographic information of grade, gender identity, and household income were measured. Then, participants answered questions aiming to determine initial knowledge and motivation towards the topic of food insecurity in BC using 5-point Likert attitudinal scales (See Appendix F). Both qualitative and quantitative data were included by asking participants to self-evaluate their knowledge in a variety of ways. The questions targeted multiple ways an individual can feel motivated towards social change, such as sharing an online post or volunteering at a non-profit.
The second portion of the first survey asked participants to evaluate each infographic with regards to graphics, colour scheme, text styles, logical flow, information grouping, and text comprehensibility (see Appendix F). The first three metrics pertained to visual design, and the last three were related to organization. Again, the evaluation scale used was a 5-point Likert scale. Levels of awareness and motivation after were also measured to compare with the initial levels. Finally, participants could choose to provide their own qualitative feedback.
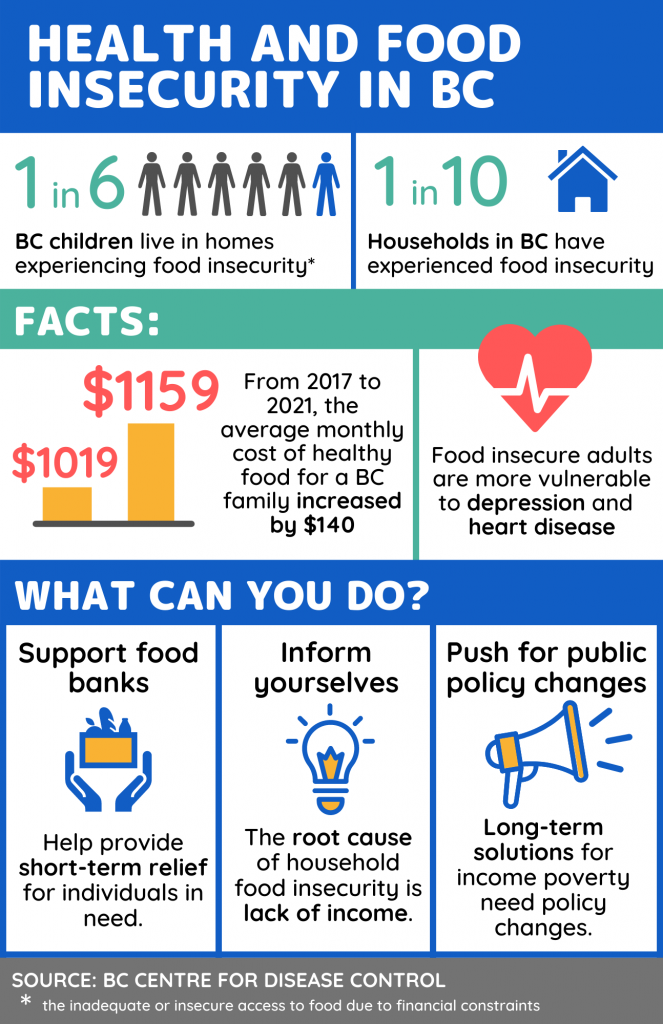
After the 2-week break, participants filled out the second survey which featured a new infographic that was improved upon following the qualitative feedback previously provided by participants (see Figure 3). They were asked to evaluate the quality with the same six metrics, as well as their final levels of awareness and motivation.
Results
There was little difference in participants’ evaluation of visual design quality between the exemplary and the poor organization infographics, as well as the new infographic. However, there was a noticeable decrease in the ratings of the poor visual design and the poor overall infographics. Generally, graphics quality was rated the highest and colour scheme the lowest across all types of infographics.
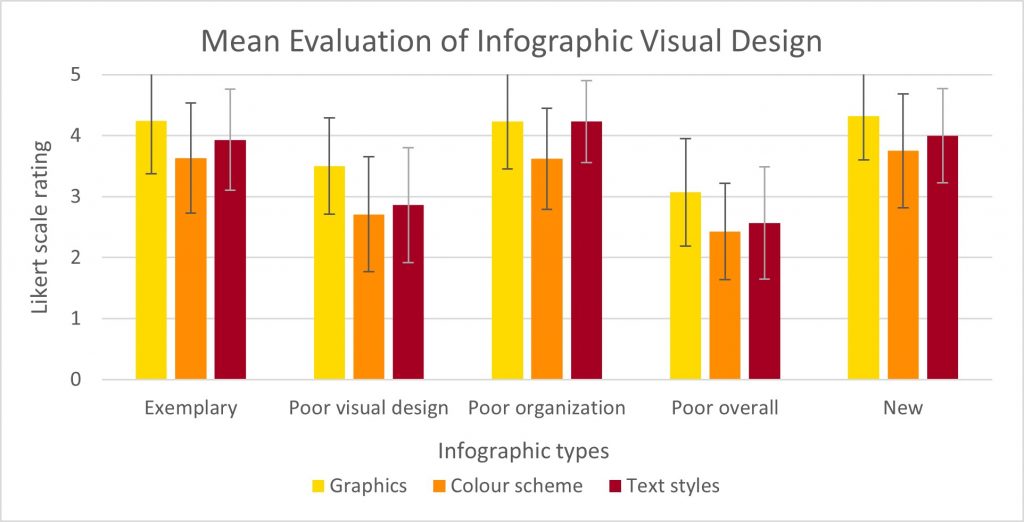
Figure 1. Bar chart of the mean ratings of each type of infographic with regards to three elements of visual design.
The exemplary and new infographics were rated very similarly in terms of organization quality, as well as the poor organization infographic, which only had a slight decrease in rating. The text comprehensibility for the poor visual design infographic was significantly lower than the other two metrics, and the poor overall infographic had lower ratings across all metrics.
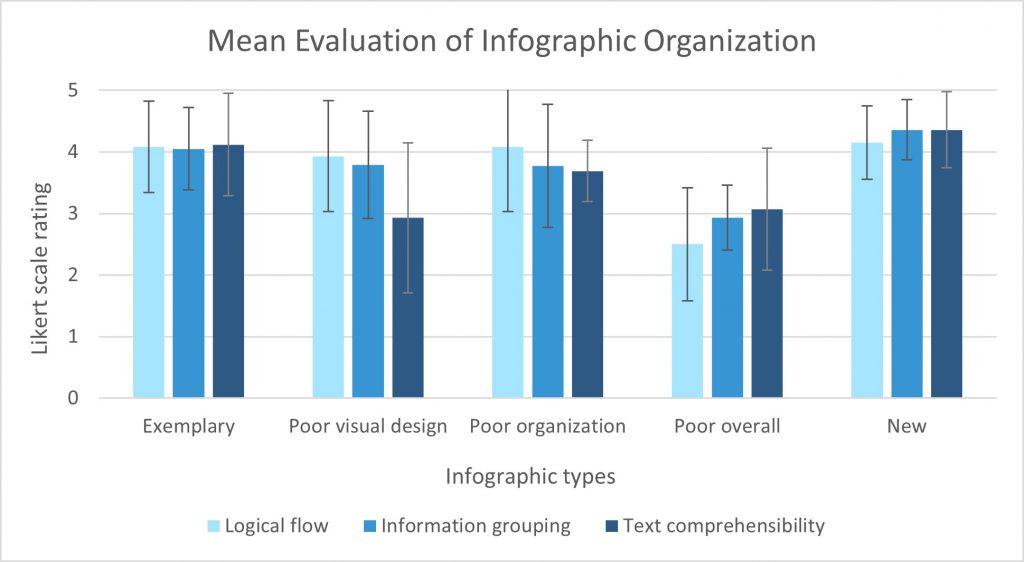
Figure 2. Bar chart of the mean ratings of each type of infographic with regards to three elements of organization.
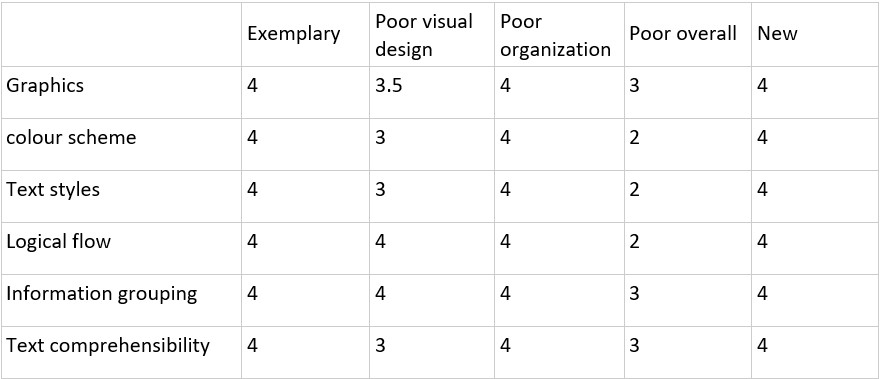
Overall, the exemplary, poor organization, and new infographics were rated very similarly across all six metrics. Only the poor visual design and poor overall infographics had median scores under 4.
Table 1. Median evaluation of infographics across all six elements of graphic design quality used in the survey.
The qualitative feedback on the first four infographics highlighted some common themes in participants’ holistic view of each type. Amount of content as well as visual design elements such as text styles and graphics were mentioned by numerous participants as potential improvements on the infographics.
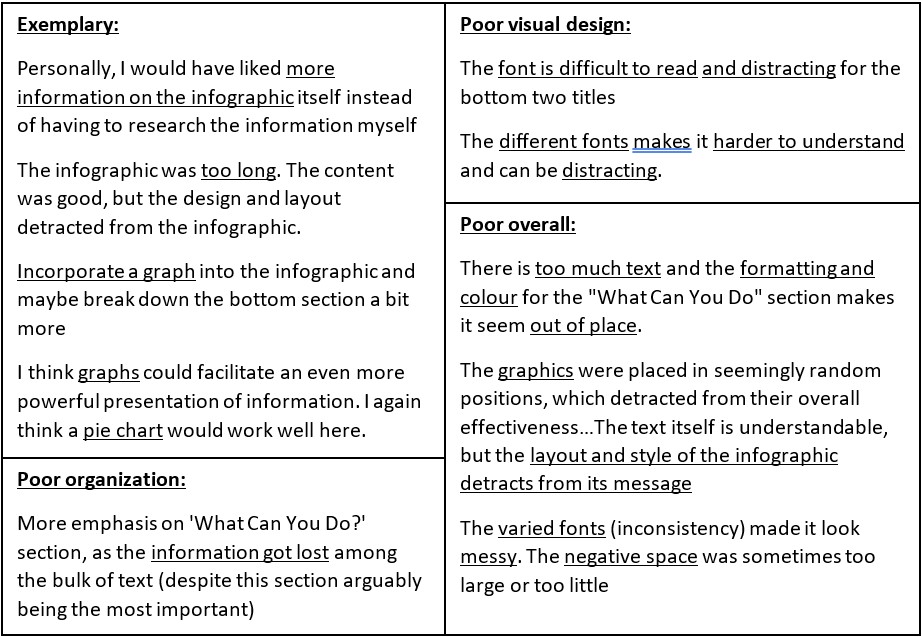
Figure 3. Key pieces of qualitative feedback collected from participants in the first survey, organized by infographic type. Important themes have been underlined, and recurring feedback was kept in mind during the design of the new infographic.
The level of motivation reported did not increase over the course of the study, but it decreased noticeably for the poor visual design and poor overall infographics. On the other hand, the level of awareness increased for the exemplary and new infographics. For the other ones, it stayed the same or decreased.
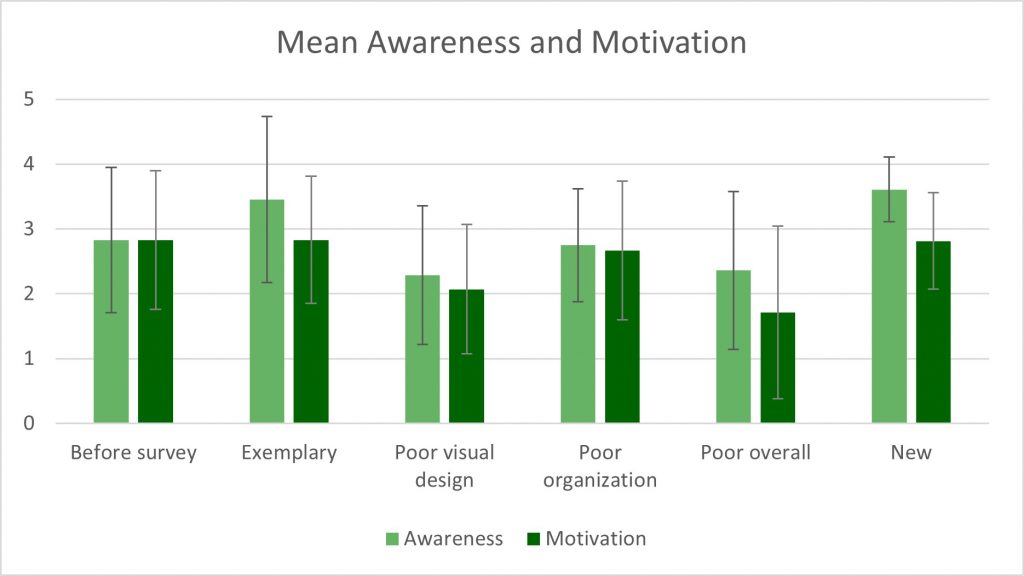
Figure 4. Bar chart of the reported awareness and motivation levels before and after completing both surveys.
Discussion
The data shows a significant drop in the perceived quality of an infographic when it has poor visual design, even when other aspects like organization are adequate. Another important detail is that the organization quality rating of the poor organization infographic is similar to the exemplary infographic, but noticeably decreases when the graphic has both poor visual design and poor organization. This suggests that visual design is a key factor in an individual’s perception of infographic quality, and that it has more influence than organization of information. The fact that the median scores of the poor organization infographic are the same as the exemplary and new graphics also support the idea that organization is not as important as visual design when it comes to audience perception of quality.
Concerning reported levels of awareness and motivation, visual design also has a great influence. The infographics that displayed a lower awareness or motivation level were also the ones which had poor visual design. Here, organization quality seems to have influenced awareness levels, but not as much as visual design. The observation that motivation levels did not increase at the end of the study suggests that a factor other than visual design and organization is responsible for encouraging motivation for social change.
To further ensure that the evaluations collected are as authentic as possible, it may be better to balance the number of positively and negatively worded statements to reduce acquiescence bias. A larger and more diverse participant sample would also serve to reduce confounding variables. For example, 10 participants did not disclose their household income. Of those who did, the most common household income was between $100,000 and $149,000. In comparison, the annual mean total income of all families in Vancouver, BC in 2019 was $91,750 (Statistics Canada, 2017). Because the sample group may be wealthier than average, this could have had an impact that was not controlled for on the results.
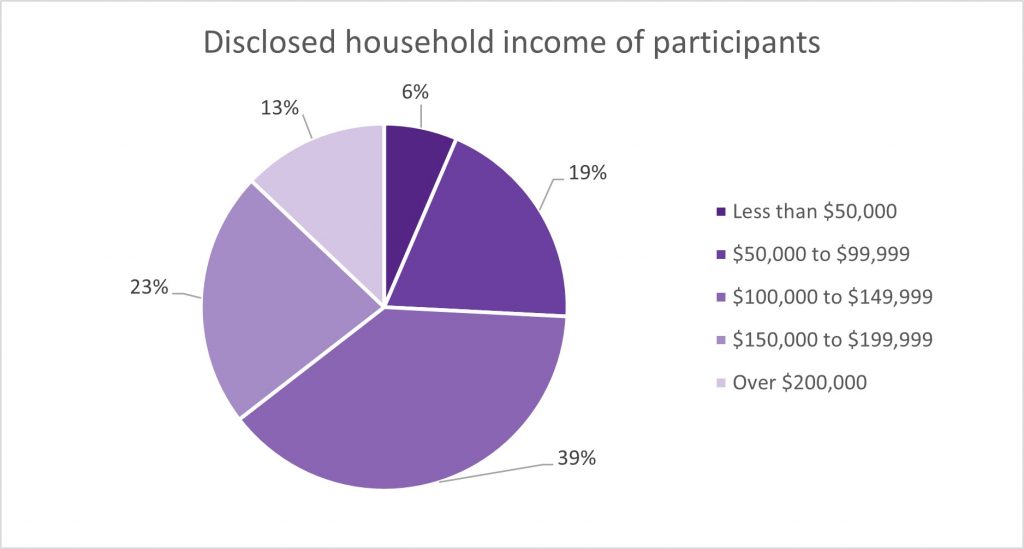
Figure 5. Pie chart distribution of the estimated annual median household income of participants who chose to disclose the data.
In addition, since there is no way to objectively quantify the actual quality of the four infographics used, this may have affected the ratings given by participants. For instance, the poor organization graphic could have been unintentionally better designed than the poor visual graphic and thus influence the results.
This study yielded similar results with the research conducted by Teixeira (2018), where there was an increase in knowledge after seeing an improved infographic about marine litter but no difference in attitude. Another study investigating adolescents’ attitudes towards Covid-19 measures after reading government-provided infographics also found that there was limited change in their conceptions (Dalen, 2021). One area for further research is to conduct the same study with other age groups to investigate whether different generations emphasize different infographic aspects when evaluating its quality.
In conclusion, this study supports the hypothesis that it is advantageous to emphasize visual design when creating infographics but suggests that motivating an audience or changing attitudes requires something entirely different. Infographics with good visual design are more likely to leave a positive impression on youth audiences and adequately inform them about a given topic, which is a useful starting point to expand on for the future of transmitting information in the digital age.
References
Al Hosni, Jokha. “The power of image in English language teaching.” Journal of Teaching English for Specific and Academic Purposes 4.1 (2016): 229-235.
Al-Mohammadi, Najwa. “Effectiveness of using infographics as an approach for teaching programming fundamentals on developing analytical thinking skills for high school students in the city of Makkah in Saudi Arabia.” Global Journal of Educational Studies 3.1 (2017): 22-42.
Bernasconi, Anna, and Silvia Grandi. “A conceptual model for geo-online exploratory data visualization: The case of the COVID-19 pandemic.” Information 12.2 (2021): 69.
Bystrova, Tatyana. “Infographics As a Tool for Improving Effectiveness of Education.” KnE Social Sciences (2020): 152-158.
Canada, Statistics Canada. Table 11-10-0009-01: Selected income characteristics of census families by family type. 15 Jul. 2021, https://www150.statcan.gc.ca/t1/tbl1/en/tv.action?pid=1110000901&pickMembers%5B0%5D=1.36&cubeTimeFrame.startYear=2015&cubeTimeFrame.endYear=2019&referencePeriods=20150101%2C20190101. Accessed 10 Apr. 2022.
Dalen, N. E. The effectiveness of persuasion via infographics. BS thesis. University of Twente, 2021.
De Haan, Yael, et al. “When does an infographic say more than a thousand words? Audience evaluations of news visualizations.” Journalism Studies 19.9 (2018): 1293-1312.
Dick, Murray. “Developments in infographics.” The Routledge companion to digital journalism studies. Routledge, 2016. 498-508.
Harold, Jordan, et al. “Cognitive and psychological science insights to improve climate change data visualization.” Nature Climate Change 6.12 (2016): 1080-1089.
Martin, Lynsey J., et al. “Exploring the role of infographics for summarizing medical literature.” Health Professions Education 5.1 (2019): 48-57.
Otten, Jennifer J., Karen Cheng, and Adam Drewnowski. “Infographics and public policy: using data visualization to convey complex information.” Health Affairs 34.11 (2015): 1901-1907.
Santos, Cristina, Maria João Pereira Neto, and Marco Neves. “The influence of infographics in accessing information: multidimensionality in visual representation and configuration of different media.” International Conference on Applied Human Factors and Ergonomics. Springer, Cham, 2018.
Siricharoen, Waralak V. “Infographic role in helping communication for promoting health and well-being.” Conference: proceedings of the second international conference on computer science, computer engineering, and education technologies (CSCEET2015). Kuala Lumpur, Malaysia. 2015.
Siricharoen, Waralak V. “Infographics: the new communication tools in digital age.” The international conference on e-technologies and business on the web (ebw2013). Vol. 169174. 2013.
Siricharoen, Waralak V., and Nattanun Siricharoen. “How infographic should be evaluated.” Proceedings of the 7th International Conference on Information Technology (ICIT 2015). 2015.
Spence, Ian. “William Playfair and the psychology of graphs.” Proceedings of the American Statistical Association, Section on Statistical Graphics. 2006.
Teixeira, Ana Sofia Gomes. “Marine litter: Social representations and persuasion in science communication through infographics.” (2018).
Tufte, Edward. “The visual display of quantitative information.” (2001).
Vanichvasin, Patchara. “Enhancing the quality of learning through the use of infographics as visual communication tool and learning tool.” Proceedings ICQA 2013 international conference on QA culture: Cooperation or competition. 2013.
Yildirim, Serkan. “Infographics for educational purposes: Their structure, properties and reader approaches.” Turkish Online Journal of Educational Technology-TOJET 15.3 (2016): 98-110.
Appendix A: Poor Visual Design Infographic
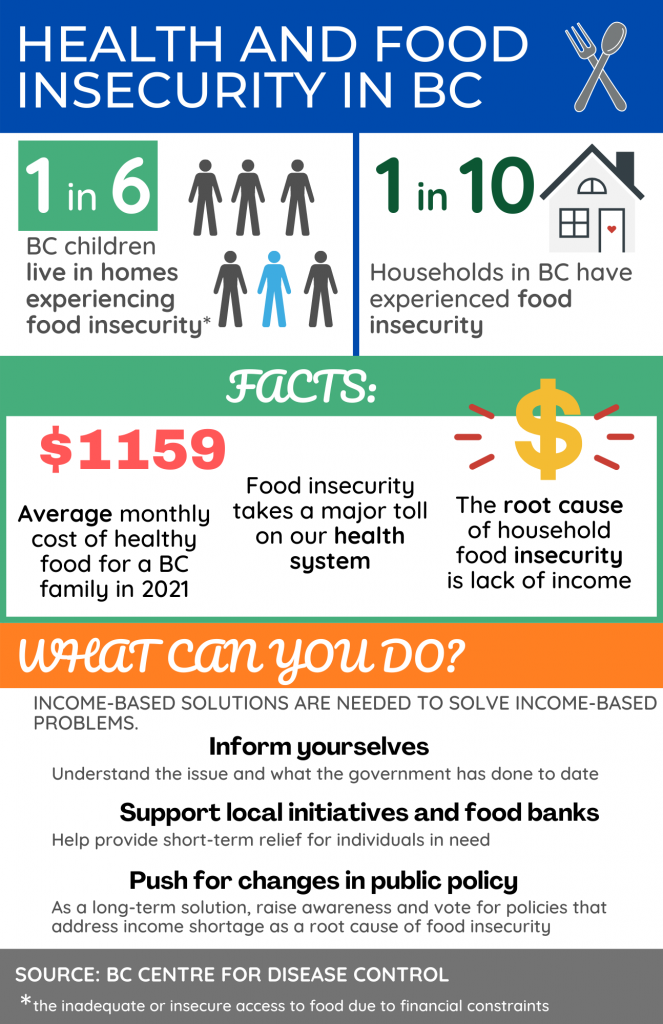
Appendix B: Poor Organization Infographic
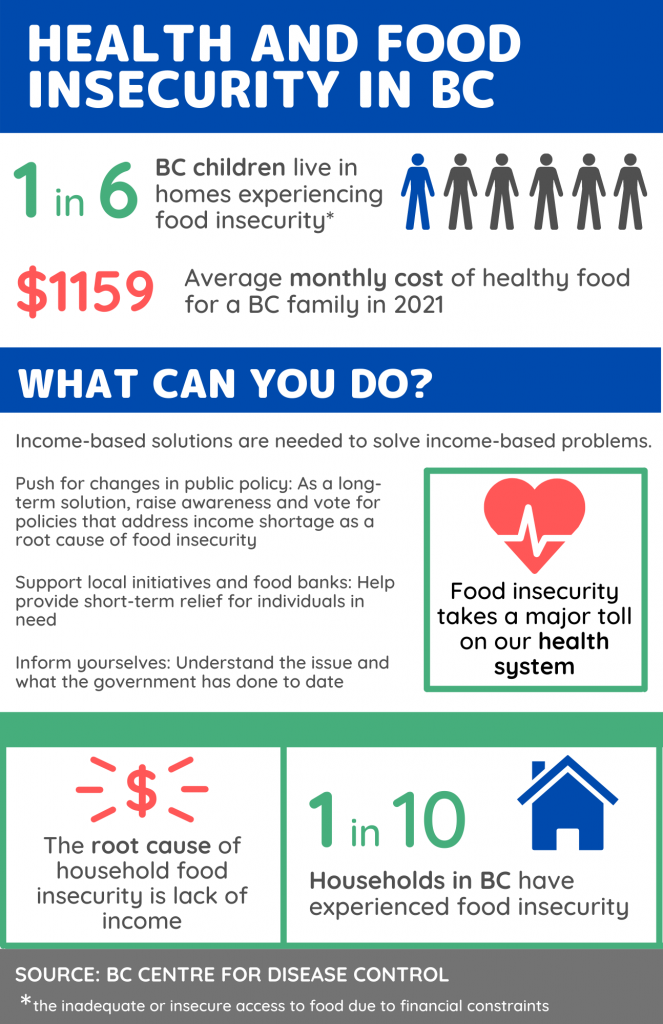
Appendix C: Poor Overall Infographic
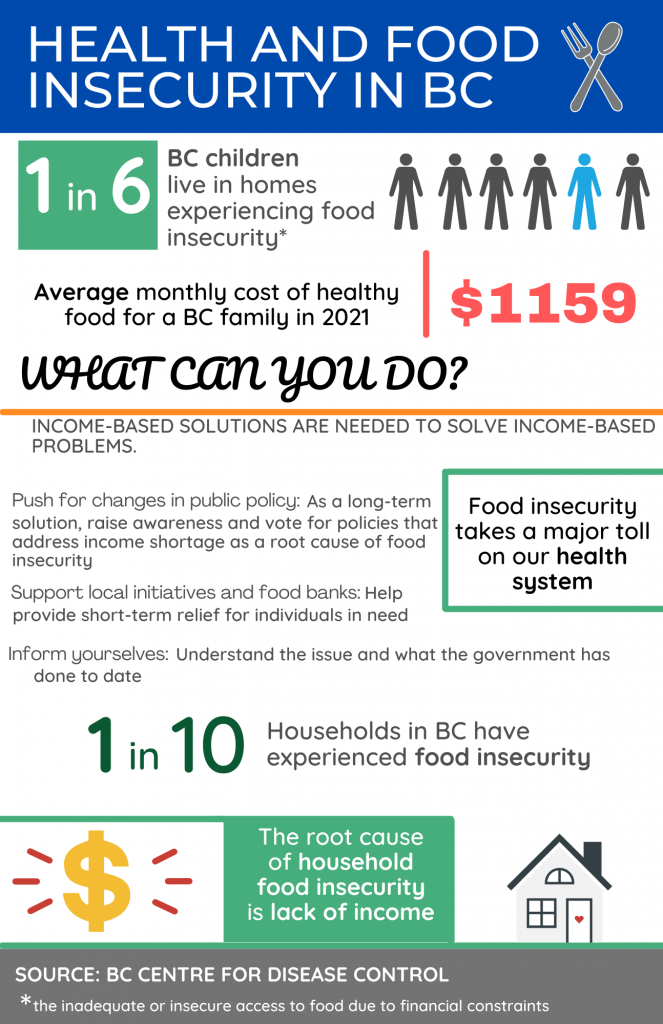
Appendix D: Exemplary Infographic
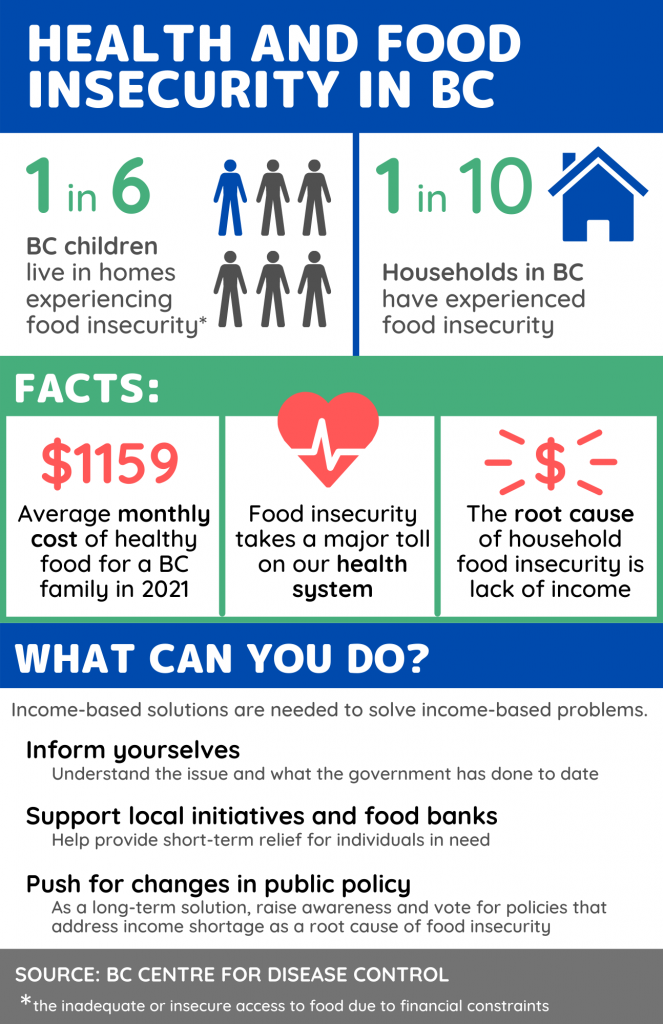
Appendix E: New Infographic
Appendix F: Survey Questions and Choices
KNOWLEDGE AND MOTIVATION TOWARDS TOPIC:
How would you describe your familiarity with the topic of food insecurity in British Columbia?
- I have never heard of it
- I have heard of it a little
- I have a basic understanding of it
- I have a good understanding of it
- I have a deep understanding of it
How many organizations that address food insecurity in BC can you name? (nonprofits, food banks, governmental programs, etc.)
- 0
- 1
- 2
- 3
- 4 or more
How likely are you to share an informative online post about social issues? (inequality, conflicts, humanitarian issues, etc.)
- Never
- Rarely
- Sometimes
- Often
- Always
How likely are you to support an organization that addresses social issues? (volunteerism, financial or physical donations, etc.)
- Never
- Rarely
- Sometimes
- Often
- Always
How likely are you to share an informative online post about food insecurity in BC?
- Never
- Rarely
- Sometimes
- Often
- Always
How likely are you to support an organization that addresses food insecurity in BC? (volunteerism, financial or physical donations, etc.)
- Never
- Rarely
- Sometimes
- Often
- Always
VISUAL DESIGN:
Please rate the degree to which you agree or disagree with the following statements:
The graphics helped with the visual appeal of the infographic.
- Strongly Disagree
- Disagree
- Neutral
- Agree
- Strongly Agree
The colour scheme looks unified and aesthetically pleasing.
- Strongly Disagree
- Disagree
- Neutral
- Agree
- Strongly Agree
The text styles help identify main sections and key ideas.
- Strongly Disagree
- Disagree
- Neutral
- Agree
- Strongly Agree
ORGANIZATION OF INFORMATION:
Please rate the degree to which you agree or disagree with the following statements:
The order of the infographic’s content makes logical sense.
- Strongly Disagree
- Disagree
- Neutral
- Agree
- Strongly Agree
The information is grouped in a way that helps with understanding.
- Strongly Disagree
- Disagree
- Neutral
- Agree
- Strongly Agree
The text is written in a way that is easily understandable.
- Strongly Disagree
- Disagree
- Neutral
- Agree
- Strongly Agree
IMPACTS OF INFOGRAPHIC:
After seeing this infographic, how would you describe your current awareness of food insecurity in BC?
- No awareness
- Low level of awareness
- Basic level of awareness
- Good level of awareness
- Profound level of awareness
After seeing this infographic, how motivated do you feel to support organizations addressing food insecurity in BC? (sharing online posts, volunteerism, physical or financial donations, etc.)
- Not motivated at all
- A little motivated
- Reasonably motivated
- Very motivated
- Extremely motivated