Jonah Angelidis-Nordlund, Year 3.
Abstract
Rivers are productive ecosystems, yet few surveys have been done on the Fraser River’s invertebrate community in particular. Fewer surveys still have been done on determining the best method given varying practical constraints of the study in question, as well as the variable nature of the data required. Consequently, a survey has been done with three different methods to determine which methods work given different practical constraints and data requirements. Three locations along the Fraser River estuary has been surveyed, and three different methods have been used to analyze the data acquired. Method 1 involved low magnification and analyzed the entire sample, which yielded statistically viable, quantitative insect data. Method 2 involved higher magnification and and analyzed the entire sample, which yielded quantitative copepod, cladocera and annelid data, while method 3 employed sub sampling for efficiency, and found copepods, and sphaeromatids. Data from method 3 was not statistically viable.
Introduction
Rivers are productive ecosystems that support a range of animal life, such as crayfish, dipterans, snails, mayflies, beetles and amphipods (William, 1991). Previous surveys done on rivers in across the world have generally not tested variables such as nutrients or salinity differences, such as surveys done on lakes or other water bodies. On surveys of the Fraser River specifically, they were not surveys of the invertebrate community. I suspect that planktonic microinvertebrates will likely include a combination of freshwater, marine and estuarine species due to their inability to swim into their preferred salinity. Despite the importance to understand the composition of the micro invertebrate and macro invertebrate communities of the Fraser River, little research is publicly available. I suspect his is due to government agencies and private companies not publishing data rather than a lack of research, as the Fraser River is a commercially important ecosystem, and it is very unlikely that no surveys have been done on the River in the past. Due to the fact that there have been few surveys on the invertebrate communities of the Fraser River, there is a need to understand the invertebrate community in order to better understand the food web of the different River habitats. Despite the need for a survey, there has been very little work done investigating the most effective method of analyzing survey data. Due to the importance of methodology in study design, such as taking into consideration practical constraints and the nature of the data required, a study investigating survey methodology is warranted.
Materials and Methods
Sampling Method
Three sampling locations representing distinct habitats in terms of salinity, depth, width and water flow along the Fraser river estuary were chosen, which included Gary Point at the mouth of the river, at the Deas slough in Ladner, British Columbia, Canada and in Langley. Sampling materials included an NHBS plankton net, bernardin mason jars, menthol crystals, a plastic salinity tester, an infrared thermometer, a plastic snap top container and a 100 ml beaker and Everclear 75.5% ethanol.
A Bernardin Mason jar was opened. The plankton net was cast into the water with a total of 45 seconds of net-in-water time. The bottom of the plankton net was emptied into the snap top container. Approx. 50 ml of ever clear brand 75.5% ethanol was measured in a 100 ml beaker, and poured into the container. The preserved sample was emptied into one of the mason jars and labelled. After approx. 24 hours, the alcohol was replaced with 20 to 30 ml of fresh alcohol.
Analysis methods
Method 1
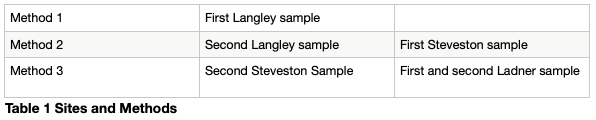
A plastic pipette had the tip cut off, and around 15 ml of the sample was added to a Petri dish. Starting at one end of the Petri dish and moving in a systematic up and down fashion each organism was rough sorted and placed into smaller, labelled plastic containers. A Hudson optical limited dissecting microscope on the 40 times magnification setting was used. This was repeated until the jar had been emptied. Analyzed sample had been discarded. The first Langley sample has been analyzed in said manner. See Table 1.
Method 2
A plastic pipette had the tip cut off, and around 15 ml of the sample was added to a Petri dish. Starting at one end of the Petri dish and moving in a systematic up and down fashion each organism was rough sorted and placed into smaller, labelled plastic containers. A Hudson optical limited dissecting microscope on the 200 times magnification setting was used to analyze the sample, and this was repeated until the jar had been emptied. Analyzed sample was discarded. The second Langley sample and first Steveston sample was analyzed in said manner. See Table 1.
Method 3
The jar has been swirled, and a plastic pipette has had the tip cut off, and around 15 ml of the sample has been added to a Petri dish. Starting at one end of the Petri dish, moving in a systematic up and down fashion, each organism has been rough sorted and placed into smaller, labelled plastic containers. A Hudson optical limited dissecting microscope on the 200 times magnification setting has been used to analyze the sample, and analyzed sample has been placed back into the jar. The second Steveston sample and Ladner samples have been analyzed in said manner. See Table 1.
Results
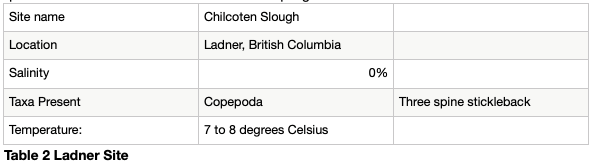
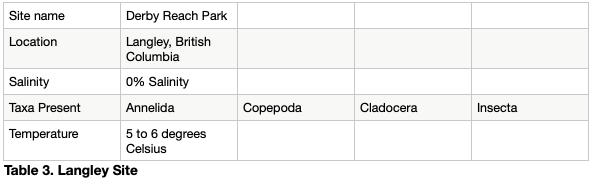
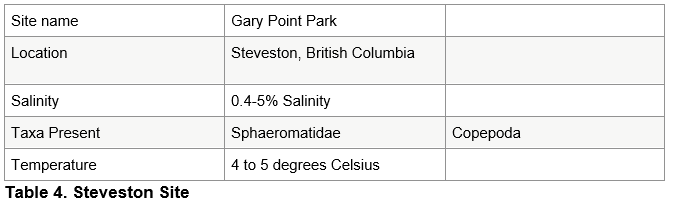
The sample from the Chilcoten slough was taken at low tide, was fresh water and between 7 and 8 degrees Celsius. The major taxa present includes a three spine stickleback and copepods. See table 2. The Langley sample was also taken at low tide, was fresh and was between 5 and 6 degrees Celsius. It included cladocera, copepods, insects and annelids. See table 3. The Steveston sample was taken at high tide, was 0.4-5% saline and was between 4 and 5 degrees Celsius. It included copepods and spheoromatids. The small volume of alcohol prevented the sample from coming out of the container in which the rough sorted samples were placed, and some of the organisms were trapped inside. See table 4.
Method 1 was used on the first Langley sample of sampling on low magnification, and going through the entire jar found a significant number of macro invertebrates. A high density of copepods was found in using Method 2 on the second Langley sample. This method is not time consuming due to the low magnification.
Method 2 was used on the second Langley sample and first Steveston sample found a high presence of micro invertebrates, as well as macro invertebrates, and this data is statistically viable given that the entire contents of the sample has been sorted. This method is the most time consuming due to the analysis of the whole sample and the high magnification. Method 3 was used on the second Steveston sample and the Ladner samples. This method found both micro and macro invertebrates. Despite the high magnification, this method was quick and efficient due to the use of sub sampling.
Discussion
It is not recommended to rough sort organisms into small containers with a small volume of alcohol, as the inability to retrieve all organisms further reduced the viability of the data. The containers would have to be washed out with rinses of alcohol, which would reduce the concentration of the rough sorted sub sample, and potentially lead to loosing data points due to inability to find them under the microscope.
Method 1 indicates a high likelihood that this method is not useful for analyzing micro invertebrate data. This is due to the low presence of micro invertebrates found. Consequently, it appears that method 1 is not useful for yielding statistically viable micro invertebrate data because it is likely to miss many organisms due to the use of the lowest magnification setting, but could yield statistically viable macro invertebrate data due to the analysis of the whole sample and sufficiency of the lowest magnification setting for identifying macro invertebrates. In this case, due to the inability to retrieve the rough sorted data from it’s container, none of the data can be considered statistically viable. The high density of cladocera is noteworthy, as cladocera tend to fluctuate widely in populations, which usually means having higher concentrations when conditions are favourably warm (Smirnov, 2017). High concentrations of copepods were not surprising due to their ubiquity across fresh water (Ferrante, and Parker, 1977, and Vinebrooke and Leavitt, 1999), brackish water (Heinle et al, 1977) and salt water (Gonzáles and Smetacek, 1994).
Method 2 was time consuming, but otherwise would be the best method due to it’s statistically viable macro and micro invertebrate data. The downside method 2 is that it takes a long time to analyze the samples in a thorough manner. Method 2 is recommended in cases where micro invertebrate data is required that is statistically viable, but should considered for surveys where statistically viable data is worth the time investment. It would be ideal when the resources for genetic analysis of samples to determine species is necessary, or where quantitative micro invertebrate data is required.
Method 3 yielded similar data to the second method without requiring a greater time investment required by method 2, but at the expense of statistically viable data. This is due to returning the used sub sample back to the jar to avoid missed data points. It is recommended to use method 3 for preliminary surveys of a water body where qualitative, presence absence data is necessary, or where only a general sense of the orders, families or genera water body is required. The three spine stickleback found in the freshwater section of the Fraser river, and I have observed the three spine stickleback in the marine boundary bay environment. This could be explained by their capacity to survive across a broad range of salinities (Gibbons et al, 2017). The sphaeromatid family occupies a range of salinities, from fresh to brackish and marine environments (WoRMS Editorial Board, 2021), which explains their presence in the brackish water of the estuary.
In summary, of the sampling methods tested method 1 should be used for macro invertebrate data, method 2 for rigorous statistical analysis of micro invertebrate data and method 3 for qualitative data to acquire a general sense of the orders, families and genera present in the water body. The data yielded throughout this survey should not be considered statistically viable quantitative data, but it is viable qualitative data. The salinity values measured were low, at values around 0% in the Chilcoten slough and up the Fraser River in Langley. At Gary Point at the mouth of the river in Steveston during high tide the salinity value was only 0.4-5%. Salinity Stratification occurs due to high winds, but the most significant is high freshwater discharges from up the river. (Sengupta et al. 2016, Schroeder et al. 1990). This may indicate that the Fraser River was discharging high amounts of freshwater at the time of sampling.
References
Chalifour, L., Scott, D. C., Macduffee, M., Stark, S., Dower, J. F., Beacham, T. D., . . . Baum, J. K. (2020). Chinook salmon exhibit long-term rearing and early marine growth in the Fraser River, B.C., a large urban estuary. Canadian Journal of Fisheries and Aquatic Sciences. doi:10.1139/cjfas-2020-0247
Ferrante J. G., Parker J. I. “Transport of diatom frustules by copepod fecal pellets to the sediments of Lake Michigan”, Limnology and Oceanography, Vol. 22, Issue 1, January 1977
Gibbons, T. C., Metzger, D. C., Healy, T. M., & Schulte, P. M. (2017). Gene expression plasticity in response to salinity acclimation in threespine stickleback ecotypes from different salinity habitats. Molecular Ecology, 26(10), 2711-2725. doi:10.1111/mec.14065
Gonzalez, Humberto E., and Smetacek Victor. “The possible role of the cyclopoid copepod Oithona in retarding vertical flux of zooplankton faecal material”, Marine ecology progress series. Oldendorf 113 (3), 233-246, 1994, Bremerhaven, Germany
Hienle D. R., Harris R. P., Ustach J. F. & Ustach D. A. “Detritus as food for estuarine copepods”, Marine Biology 40 (4), 341-353, 1977
Hosie, Andrew. “A sea slater (Lekanesphaera rugicauda)”. MarLIN (Marine Life Information Network). The Marine Biological Association. Retrieved April 21, 2020.
Mason, William T. “A Survey of Benthic Invertebrates in the Suwannee River, Florida.” Environmental Monitoring and Assessment, vol. 16, no. 2, Feb. 1991, pp. 163–87. Springer Link, doi:10.1007/BF00418103
Sengupta, Debasis, et al. “Near-Surface Salinity and Stratification in the North Bay of Bengal from Moored Observations.” Geophysical Research Letters, vol. 43, no. 9, 2016, pp. 4448–56. Wiley Online Library, doi:https://doi.org/10.1002/2016GL068339.
Schroeder, William W., et al. “Salinity Stratification in a River-Dominated Estuary.” Estuaries, vol. 13, no. 2, June 1990, pp. 145–54. Springer Link, doi:10.2307/1351583.
Smirnov, N. Nikolai “Physiology of the Cladocera” (second addition), 2017, Academic Press
Vinebrooke D. Rolf, Leavitt R. Peter. “DIFFERENTIAL RESPONSES OF LITTORAL COMMUNITIES TO ULTRAVIOLET RADIATION IN AN ALPINE LAKE” Department of Biology, University of Regina, Regina, Saskatchewan, Canada, Published by: The Ecological Society of America, (1999) pp 223-237
WoRMS Editorial Board (2021). World Register of Marine Species. Available from http://www.marinespecies.org at VLIZ. Accessed 2021-04-11. doi:10.14284/170