Abrielle Chan, Year 2 Research
Abstract
In an age where sustainable and earth-friendly methods of living have become more important, methods of conserving water must be investigated. This project aims to reduce potable water consumption through reuse of greywater for watering household gardens. To ensure that greywater can be used in gardens, Scarlet Runner bean plants were watered with different samples of greywater. The growth of each plant was measured over the course of a month. Pasteurized greywater had no adverse effect on the growth of the plants, suggesting that greywater can be reused in gardens and can therefore conserve potable water supply. Further research must be conducted to ensure that pasteurized greywater has no negative effects on human health.
Introduction
As populations rise and global warming exacerbates water scarcity, it is crucial to begin further research and implementation of water conserving methods. Greywater is gently used water from sinks, showers and washing machines. In practice, greywater is implemented in buildings such as the Margot and Harold Schiff Residences, Mercy Housing and Quayside Village Gray Water Demonstration Project in British Columbia by use of greywater in toilet tanks and flushing.
The practice of greywater reuse can reduce potable water consumption by 30% (Radcliffe, 2003). However, there is still reluctancy to integrate this practice into everyday life.
The reuse of greywater has not been more widely adopted due to an uncertainty around the cleanliness and effects greywater can have on health. For example, greywater that contains bleach, borax, and other cleaning agents cannot be used to irrigate gardens since the chemicals can damage the plants. Greywater from sinks can contain a large amount of fats, oils and greases, which is also not suitable for irrigating gardens (Duttle, 1994). A study conducted by the Water Environment Research Foundation (WERF) showed that there could be thousands of chemicals present in greywater, and studies performed in the past using indicator organisms could be inaccurate. For instance, the indicator organisms may multiply while being stored, or they may become inert (WERF, 2012). In a different study, it was found that the use of bacterial indicators such as E. Coli can overestimate the fecal load in the water samples. (Ridderstople, 2004). In general, studies on greywater reuse and effects on health and safety have mixed conclusions.
The reuse of greywater is rendered more attractive via greywater treatment systems, but the downside of this technique is cost. However, a study of existing sanitation projects in Norway found that the treatment of greywater achieves almost ‘zero emissions’ and nearly complete recycling (Jenssen, 2002). They found that household potable water consumption can be decreased by up to 50%. (Jenssen, 2002).
Some common methods of water sanitation and conservation include UV disinfection, fine filtration, pump treatment processes, and pasteurization. UV disinfection is a popular choice for water disinfection due to the high effectiveness, low energy cost, and easy maintenance. However, UV light is only effective against bacteria and other organisms and cannot eliminate stronger contaminants such as chlorine (United States Environmental Protection Agency, 1999) Fine filtration is also costly, with some units requiring professional installation and constant maintenance. However, fine filtration enables customization of filters to fine-tune the removal of contaminants. Pump treatment requires less maintenance than fine filtration and can be safer and more efficient to fix; however, it is prone to flooding.
Overall, greywater sanitation can be expensive and hard to maintain. Implementing these sanitation methods in the home can be challenging. This project employs pasteurization as a method of disinfecting the greywater samples, which is more cost-effective and accessible. This project aims to determine whether pasteurized greywater affects of plant growth. It is hypothesized that pasteurized greywater will have little adverse effects on the growth of Scarlet Runner plants.
Materials and methods
Scarlet runner beans were used due to their peak planting time and rapid growth. The peak planting time is the last frost of the year up to until early summer. Prior to planting in soil, 16 beans were submerged in warm water for 12 hours in a plastic container. This allows the beans to sprout. After 12 hours, two beans were planted in eight pots filled with soil. The pots were labelled with a corresponding group number to designate control and experimental groups. The beans were placed in a one inch well in the soil before being covered.
Greywater samples were collected throughout the week from the bath. The samples were then split into four groups as follows: Group 1: Control (tap water), Group 2: Greywater collected on Monday and stored in a mason jar throughout the week (not pasteurized), Group 3: Pasteurized greywater that is used the day of sanitization, Group 4: Greywater that is used the day of collection but is not sanitized. The samples of greywater that needed to be stored were collected on a Monday and left in a mason jar until Friday. The samples that did not need to be stored were collected and sanitized if needed on Fridays.The eight pots were placed in a well-lit window, allowing for maximum sunlight without the risk of damage due to strong winds. The ‘sprouting day’ was defined as the day on which the bean’s green sprout could be visualized. The plants were watered every Friday from February 11 to March 21. The growth of the plants was measured in cm using a flexible ruler, and an average of the four plants in each group was taken. Measurements were taken every other day. A pH soil tester was also used to check if the pH of the soil underwent any changes throughout the growing process. Qualitative measurements were also noted. The experiment duration was 38 days.
Results
Average plant growth in cm was recorded in an excel spreadsheet, and the plotted graph of the data is shown below. Each line is the average height of the 4 bean plants in each group. The blue line corresponds to Group 1 (Tap Water Control), the orange line corresponds to Group 2 (Unsanitized, Stored Greywater), the grey line corresponds to Group 3 (Sanitized, Unstored Greywater), and lastly the yellow line corresponds to Group 4 (Unsanitized, Unstored Greywater).
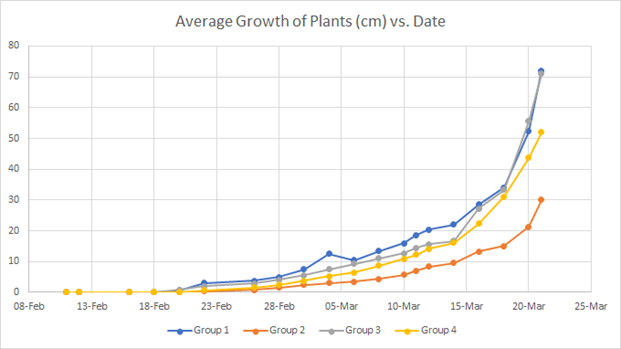
Figure 1: Graph of Average Growth of Plants vs. Date
All of the bean plants showed a similar pattern of growth, with earlier dates showing less growth per measuring day and later dates showing more growth per measuring day. It can be seen that Group 1 and Group 3 have extremely similar curves, ending at around the same final average height. Group 1 had a final average height of 72 cm, Group 3 had a final average height of 71 cm, and Group 4 had a final average height of 52 cm. The group with the 38-day period was Group 2, with an average height of 30 cm.
The graph below shows the sprouting days of each of the plants.
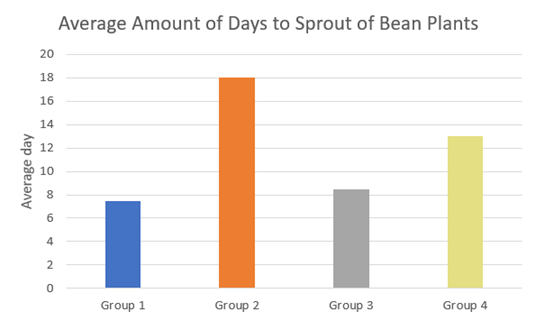
Figure 2: Chart of Average Amount of Days to Sprout for Bean Plants
As seen in Figure 2, Groups 1 and 3 had the earliest sprouting days, followed by group 4 and then group 2, which had the latest sprouting day.
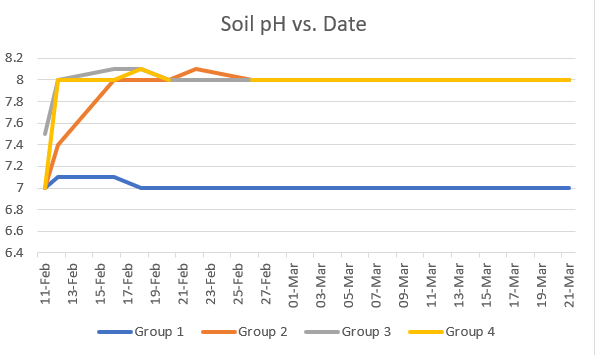
Figure 3: Graph of Soil pH vs. Date
The
pH of each of the samples is shown in Figure 2. Group 1 remained at a pH 7, and
the rest of the groups remained at a pH 8.All plants were green and showed no signs of
death, except for Group 2. The 2-A (right) showed some yellowing on day 30 of
the experiment which persisted until the final day. The 2-B (right and left)
plants showed yellowing of leaves that turned into decay on day 31. The decayed
leaves fell off 2 days afterwards.
Discussion
The purpose of this study was to determine if greywater had any detrimental effects on plant growth. In general, the plants watered with tap water and the plants watered with sanitized greywater that was not stored had the best growth curves, consistently showing taller heights compared to the other groups. In addition, the plants that had been watered with tap water and the plants that had been watered with unstored sanitized greywater had very similar growth curves and the average height measurements differed by 1 cm. These observations can be explained by the fact that the group watered with unstored and sanitized greywater received the cleanest greywater samples that were pasteurized and used the day of the collection. Although the cfu (colony forming unit) of the samples was not taken, it was found in other studies that the storage of the greywater allows for more bacterial growth (WERF, 2012). The plants that received unsanitized greywater used day-of exhibited a strong growth curve as well, similar but slightly worse than the plants given tap water or unstored sanitized greywater. The plants watered with greywater that was not sanitized and stored, however, had a significantly worse growth curve. The final average height of group 2 was 30 cm, which is 42% of the average height of the plants in group 1, which represents a 240% decrease in height. These results can be explained by the fact that the plants were the most likely to have contaminants; they were not sanitized and stored for seven days at room temperature. The difference in pH of the soils did not seem to have adverse effect on the plants, as the plants given tap water or unstored sanitized greywater had comparable heights and showed no signs of death, despite different pH measurements. However, this variable would need to be better controlled in future experiments as it could confound results.
The results shown in the first graph also correspond with the 2nd sprout chart, Figure 2. Groups watered with tap water or unstored sanitized greywater had the earliest sprouting days, followed by the groups watered with unsanitized, unstored greywater and unstanitized stored greywater. This follows the final average height order. However, Group 2-A’s right plant (unsanitized and stored greywater) and group 2-B’s right plant (unsanitized and stored greywater) sprouted extremely late. This group was also the only group that showed signs of death and yellowing. All plants were placed in the same indoor location with the same amount of light, and were treated the same experimentally. The cause of this delay of sprouting is not known for sure, but late sprouting is often attributed to lack of light. It is possible that the lighting differed slightly for that group of plants. A study showed that there are many different variables that can affect the bacterial load of stored water. They found that temperature played a big role in affecting the rate of growth of bacteria, and water stored in tightly sealed containers remained more biologically stable for a longer amount of time (Yaojun Zhang 2019). These variables were not ones that I had controlled, which could have affected my results.
Some sources of error could have been differing watering placement, lack of bean quality control and unmonitored amounts of shampoo, soaps and other substances More research could be conducted to identify exactly what substances in the greywater samples caused the decrease in height for Group 3, however since Group 2, 3 and 4 all had soap and shampoo, perhaps those added substances had no effect on plant growth. This could be conducted by monitoring variables such as temperature, nutrient content, sealing of the storage containers and container material while testing for cfu. The experiment conducted provides insight into greywater reuse, and could be used to further investigate greywater reuse as a method to conserve potable water supply.
References
Radcliffe, John. “Water Recycling in Australia: A review undertaken by the Australian Academy of Technological Sciences and Engineering” Australian Academy of Technological Sciences and Engineering Ian McLennan House, 2004, https://www.atse.org.au/wp-content/uploads/2019/01/water-recycling-in-australia.pdf
Duttle, Marsha. “Safe Use of Household Greywater”, College of Agriculture, Consumer and Environmental Sciences New Mexico State University, 1994, https://aces.nmsu.edu/pubs/_m/M106/welcome.html
WERF. “Long-Term Effects of Landscape Irrigation Using Household Graywater”, Water Environment Research Foundation, 2012, http://web.archive.org/web/20111011155736/http://www.werf.org/AM/Template.cfm?Section=Research_Profile&Template=/CustomSource/Research/PublicationProfile.cfm&id=03-CTS-18CO
Ridderstolple, Peter. “Introduction to Greywater Management”, 2004, https://greywateraction.org/health-studies-greywater/
Jenssen, Petter D. “Design and Performance of Ecological Sanitation Systems in Norway”, Department of Agricultural Engineering, Agricultural University of Norway, 2002, http://www.ecosanres.org/pdf_files/Nanning_PDFs/Eng/Jenssen%2052_E41.pdf
“Wastewater Technology Fact Sheet: Ultraviolet Disinfection”, United States Environmental Protection Agency, 1999, https://www3.epa.gov/npdes/pubs/uv.pdf