Jennifer Tindall, Year 2 Research
Abstract
As demand for supply goes up, more space and resources are required to meet it. Because of this pressure for mass manufacturing and animal agriculture, there has been an increase in deforestation globally for decades. As a result, some researchers have connected increased malaria cases in Amazonian countries to the pattern of forest loss in the Amazon. This study examines rates of deforestation in each Amazonian country to observe if there is a link between forest loss and an increase in national malaria cases. Malaria rates have been collected to account for population differences using the Annual Parasite Index model (API) and were examined next to yearly deforestation data. A Pearson correlation test was run to measure the correlation in the relationship between deforestation and malaria rates. The results suggest that at a certain level of deforestation, there is a national increase in malaria cases; however, most of the countries were not affected.
Introduction
As global consumption continues to rise, land clearing and deforestation follows, particularly across the tropics (Tilman et al, 2011; Austin et al. 2017). The Amazon Rainforest is disappearing quickly due to development pushing the frontier, which may permanently alter biodiversity (Nobre et al, 2016). Resource extraction has also been shown to compromise access to water, loss of native habitats, regional climate alterations affecting biomass, species composition, and importantly, the distribution of infectious diseases (Foley et al, 2005), including malaria. Malaria is a vector-borne disease transmitted through the bites of Anopheles darlingi (A. darlingi) female mosquitos (WHO, 2014). In neotropical areas, A. darlingi mosquitoes are the main malaria vector, responsible for over a million cases of malaria per year in that region alone (Marinotti et al, 2013). Research has shown that Amazon deforestation drives malaria transmission through ecological and socioeconomic mechanisms (MacDonald and Mordecai, 2019).
From an ecological standpoint, deforestation causes a change in the abundance of breeding sites, affecting shade, vegetation, and hydrology, all of which are crucial factors in the mosquito lifecycle. The A. darlinigi larvae thrive at the frontier of agricultural development, where little forest remains. This suggests that A. darlingi are attracted to conditions from human settlement often seen by farmers in the amazon basin (A. Y. Vittor et al, 2006). The forest margins are principal breeding sites due to ideal conditions such as, adequate sitting water, both shade and direct sunlight, a temperature of 20-28C, and a pH of 6.5-7.3 (Hiwat and Bretas, 2011).
Additionally, deforestation affects the microclimate suitability for pathogen development by influencing local weather which alters the ambient temperature (MacDonald and Mordecai (2019); Patz and Olson (2006)). Temperature affects mosquitoes’ rate of biting, reproduction, development and survival across different life stages and the probability of becoming infectious after biting an infectious host. In Brazil 99.8% of total malaria cases happen in the amazon area, despite A. darlingi mosquitoes being present in over 80% of the country (Oliveira-Ferreira et al, 2010), suggesting that deforestation disrupts the microclimate in a favourable way for the mosquitoes. Lastly, deforestation reduces biodiversity and therefore loss of biological control, which can increase the vector abundance of A. darlingi mosquitoes (Chaves et al, 2020).
In addition to these ecological changes, the migration of settlers and communities built on the edges of the Amazon contribute to the propagation of Malaria in the Amazonian countries. Due to the construction of roads associated with agricultural development, exposure to mosquitoes increases (A. Y. Vittor et al. (2006); Patz Jonathan A. et al. (2004)). Indeed, malaria rates have been documented to be higher during early stages of deforestation (MacDonald and Mordecai, 2019), which then decline with urbanization. As settlements grow and move further away from the forest fringe, exposure to malaria decreases. However, since settlements are not permanent, resettlement contributes to a cycle of increased malaria risk at the frontier of the Amazon (Castro et al, 2006). These and other factors underpin the link between malaria transmission and deforestation in small regions near the forest fringe (Castro et al. (2006); Harris et al. (2006); MacDonald and Mordecai (2019); A. Vittor et al. (2006)). However, more research is needed to address the connection between deforestation and malaria on a national scale.
This study aims to answer the question, “Is increased Amazonian deforestation connected to the rate of malaria cases in surrounding countries on a large scale?” It is hypothesized that the more deforestation there is, the higher level of malaria there will be.
Method and Materials
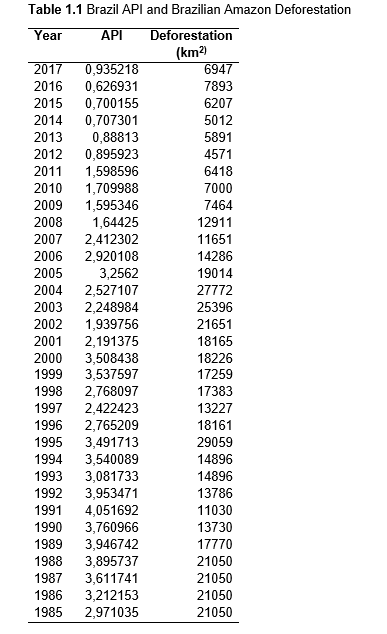
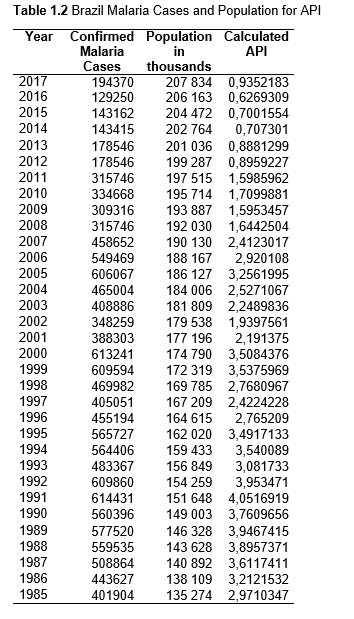
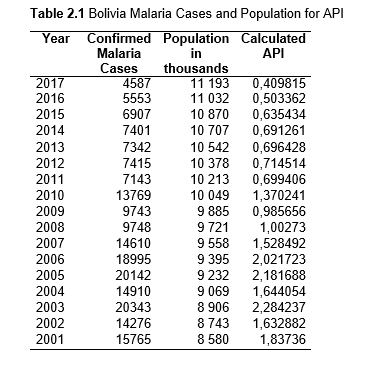
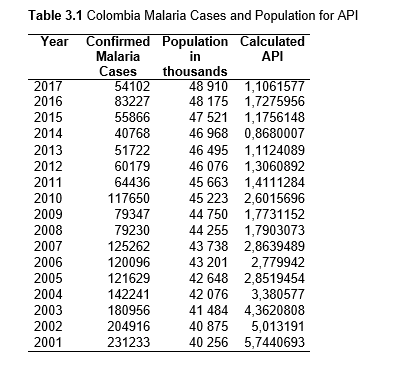
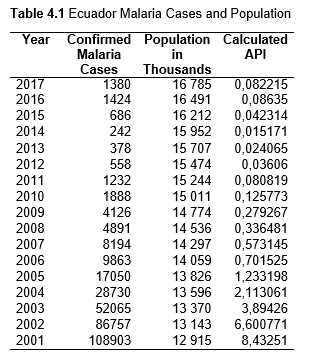
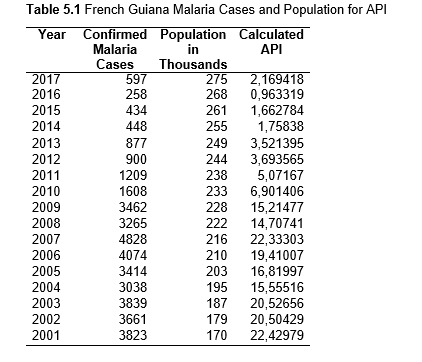
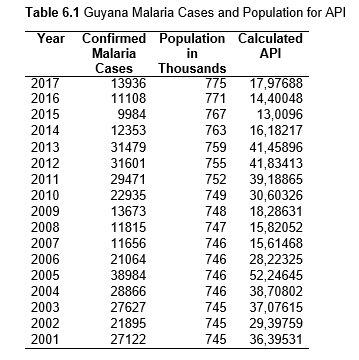
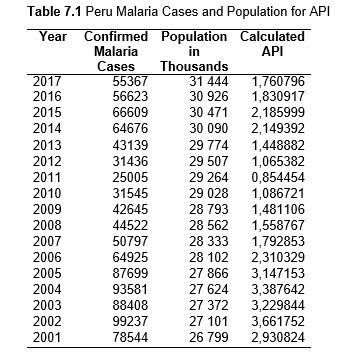
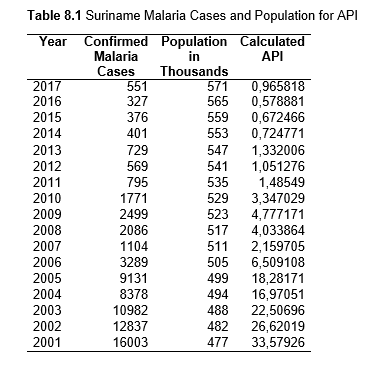
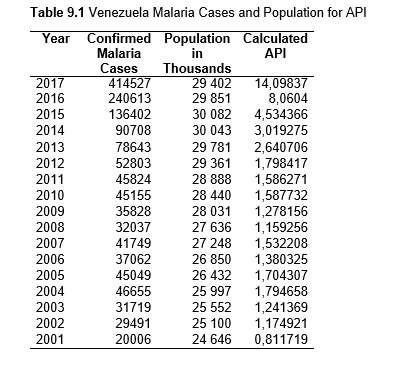
To study the correlation between national deforestation rates and national malaria rates in the Amazonian countries, data sets from 2001-2017 for Colombia, Peru, Venezuela, Bolivia, Ecuador, Guyana, Suriname, and French Guiana, as well as from 1985-2017 for Brazil were obtained and analyzed. First, malaria rates for each country were collected, then population data. Using both the data sets, the Annual Parasite Index (API) was calculated and used for the analysis. API is used to measure the amount of confirmed malaria cases per thousand people per year in a set geographical region (Smith et al.).
API = (confirmed cases during 1 year/population in defined region) x 1,000
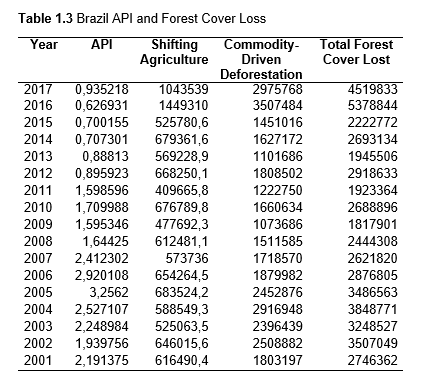
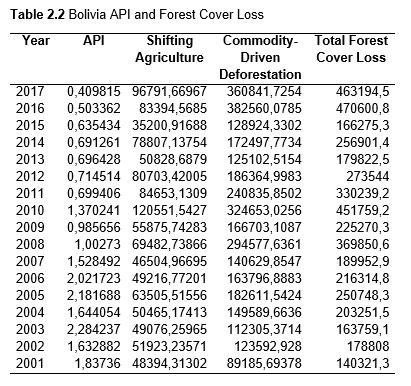
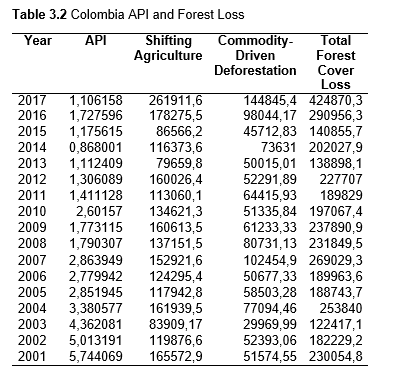
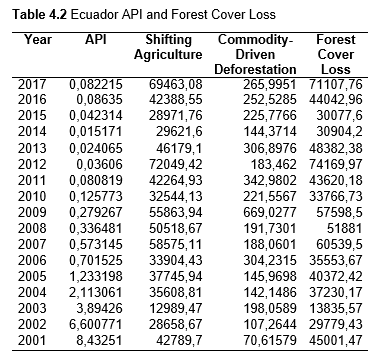
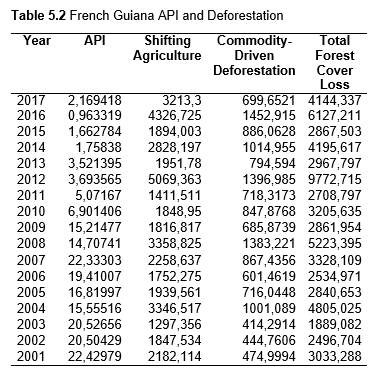
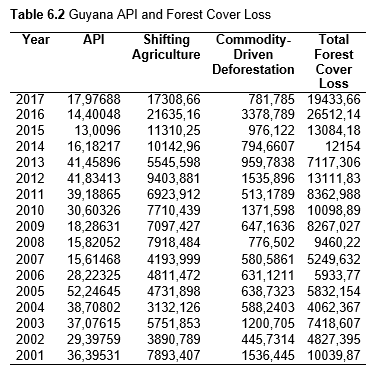
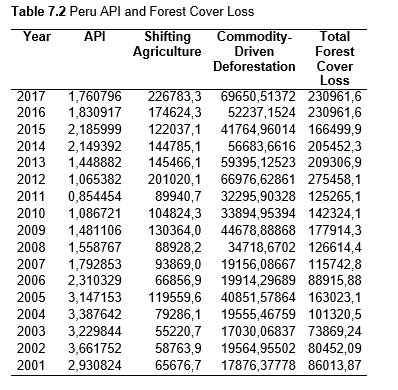
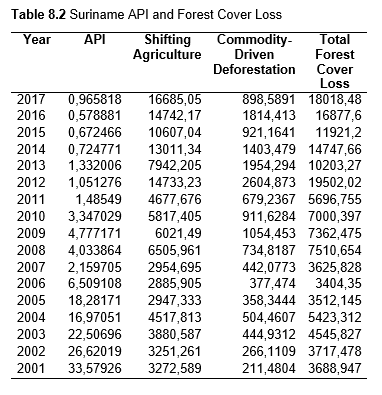
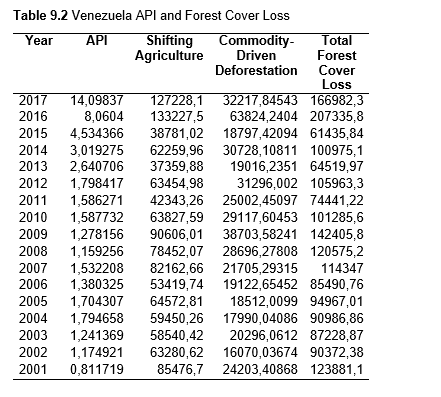
Then deforestation data was collected. This includes Total Tree Cover Loss and the two primary drivers of deforestation: Commodity-Driven Deforestation and Shifting Agriculture (see Supplementary Information). In addition to these sets, Brazil was examined with an additional data set examining Brazilian Amazonian deforestation. All data can be seen in the supplementary information under each country (Tables 1.1, 1.2, 1.3, 2.1, 2.2, 3.1, 3.2, 4.1, 4.2, 5.1, 5.2, 6.1, 6.2, 7.1, 7.2, 8.1, 8.2, 9.1, and 9.2).
Pearson’s correlation was used to examine the association between deforestation and the prevalence of malaria. The correlation was calculated for each country for API with Total Forest Cover Loss, Shifting Agriculture, and Commodity-Driven Deforestation using values for the years 2001-2017. An additional test was run for Brazil using the INPE deforestation data with API for the years 1985-2017.
Results
This study was done to see if there is a correlation between the level of national deforestation and national malaria rates in the countries surrounding the Amazon. Brazil has the highest rates of Total Forest Cover Loss, Commodity-Driven Deforestation, and Shifting Agriculture (Figure 2.1, 2.2), which is further shown in Figures 2.3-2.5.

Figure 2.1 Dominant Deforestation Drivers in ha by Country
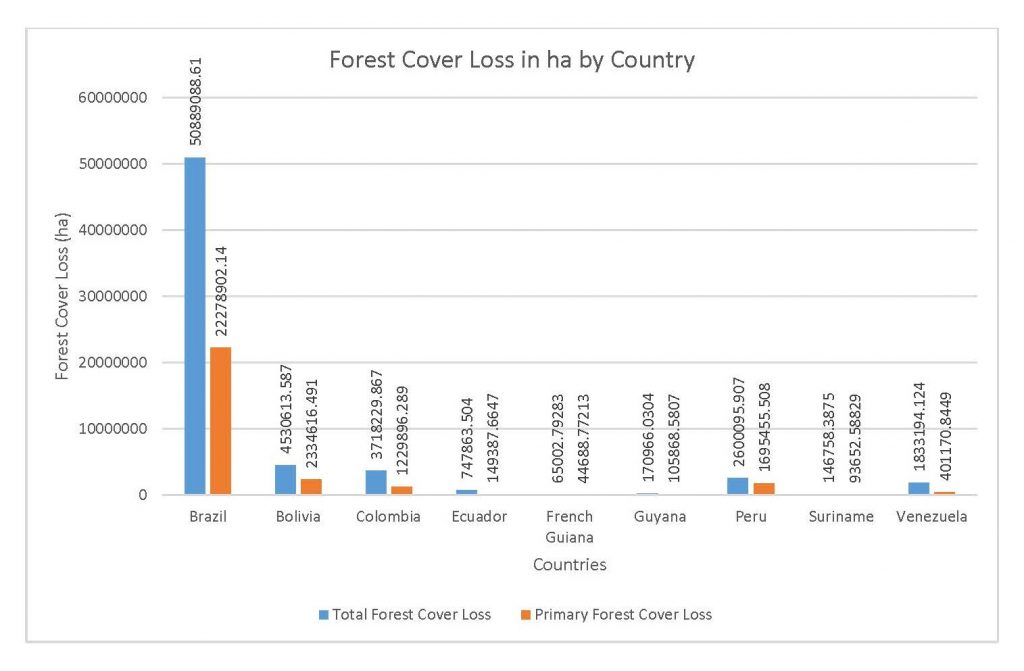
Figure 2.2 Forest Cover Loss in ha by Country

Figure 2.3 Total Forest Cover Loss by Country
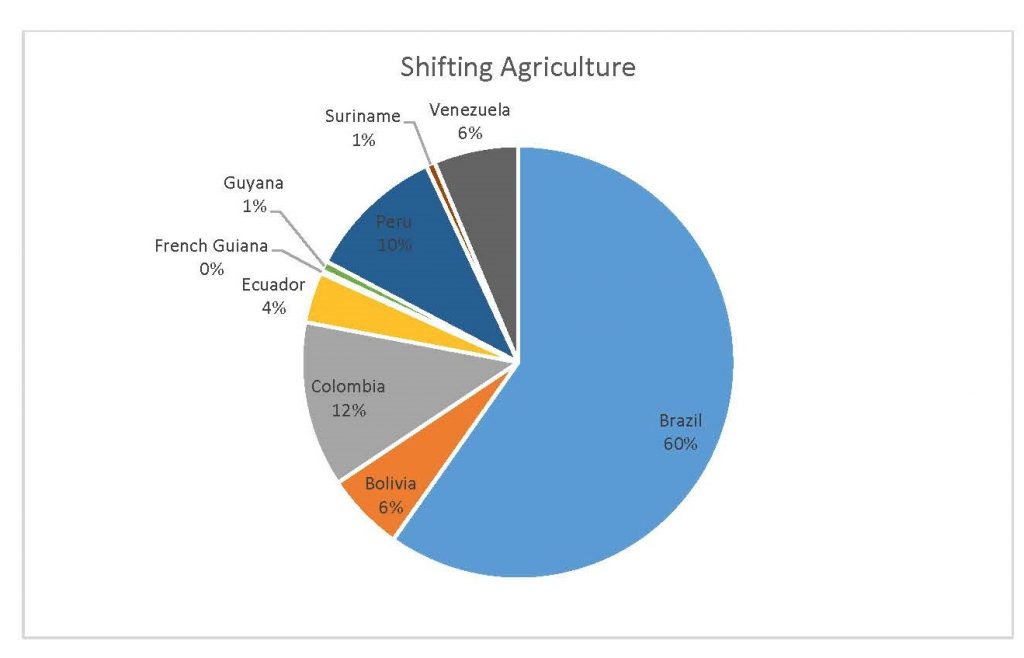
Figure 2.4 Shifting Agriculture Percent by Country
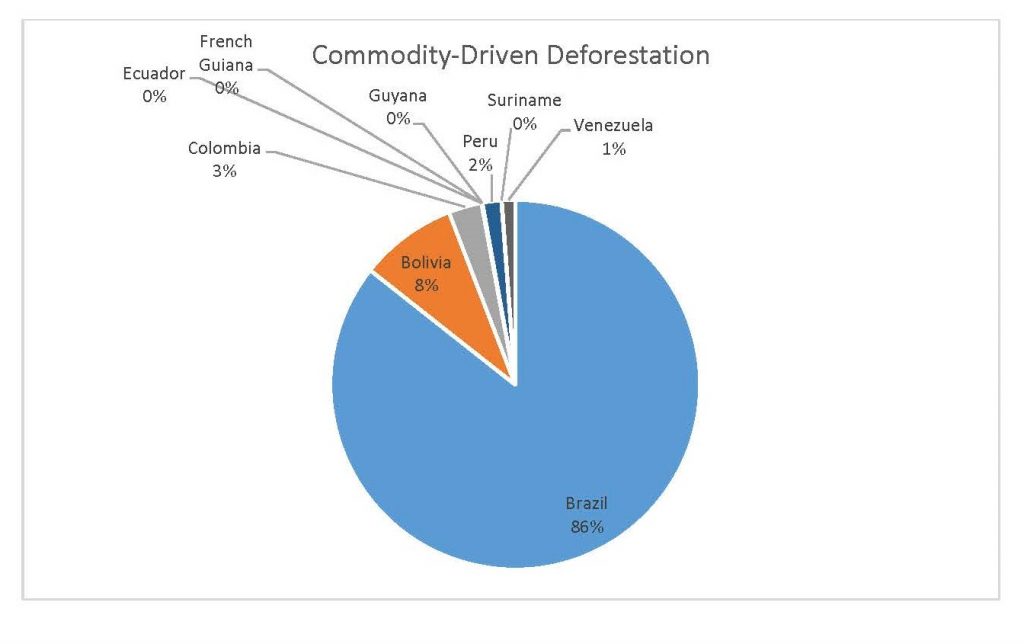
Figure 2.5 Commodity-Driven Deforestation by Country
When the Total Forest Cover Loss in the Amazon region during the 17-year span is added together for all the countries, their division of contribution to the grand total is Brazil: 79%, Bolivia: 7%, Colombia: 6%, Peru: 4%, Venezuela: 3%, Ecuador: 1%, French Guiana: 0%, Guyana: 0%, and Suriname: 0%. For Shifting Agriculture, it was Brazil: 60%, Colombia: 12%, Venezuela: 6%, Bolivia: 6%, Ecuador: 4%, Guyana: 1%, Suriname: 1%, and French Guiana: 0%. Finally, for Commodity-Driven Deforestation, it was Brazil: 86%, Bolivia: 8%, Colombia: 3%, Peru: 2%, Venezuela: 1%, and Ecuador: 0%, French Guiana: 0%, Guyana: 0%, and Suriname: 0%. Brazil also has the largest population and most confirmed malaria cases (refer to Table 1.2).
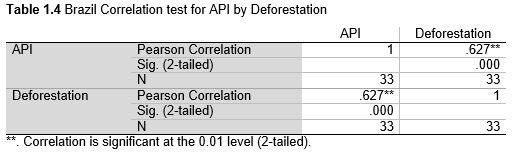
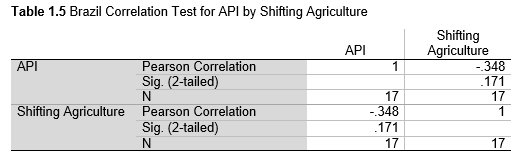
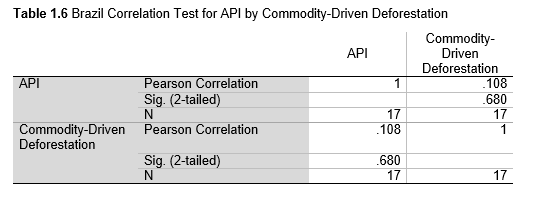
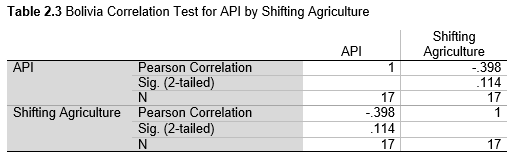
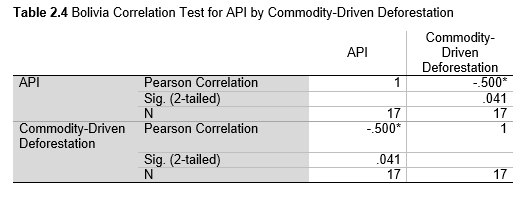
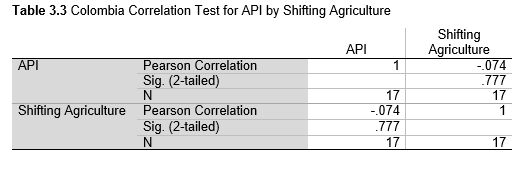
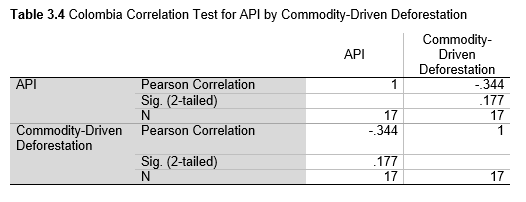
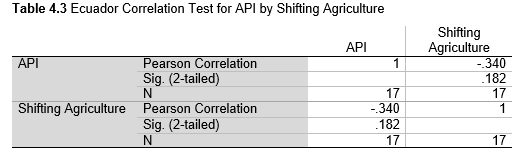
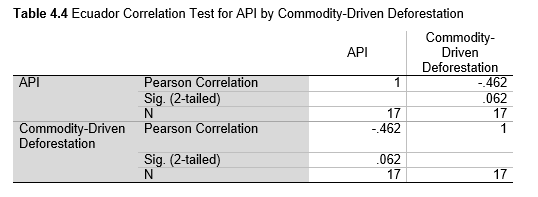
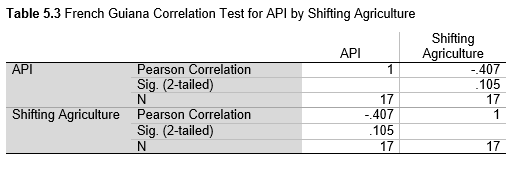
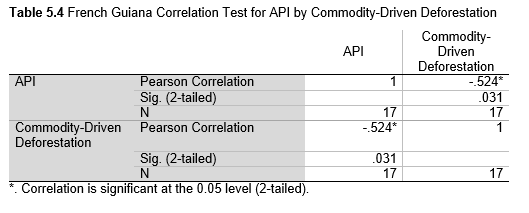
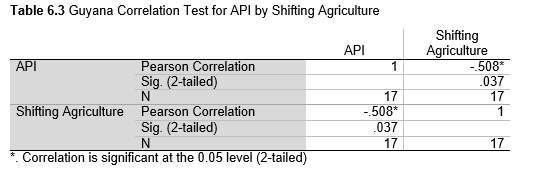
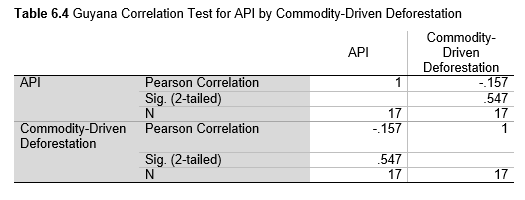
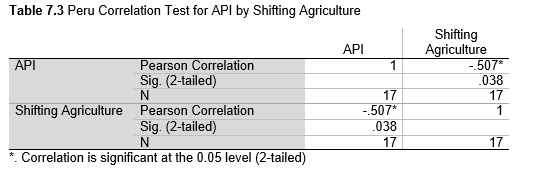
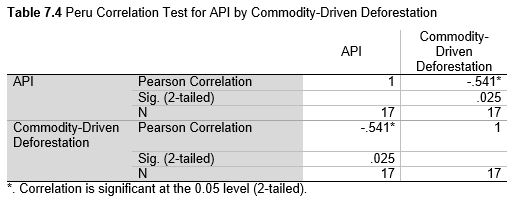
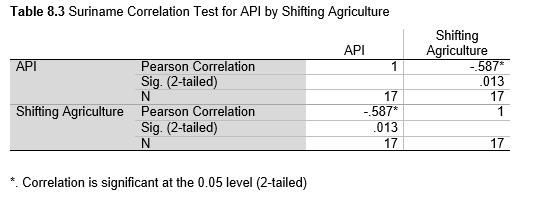
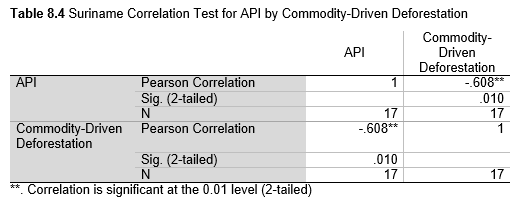
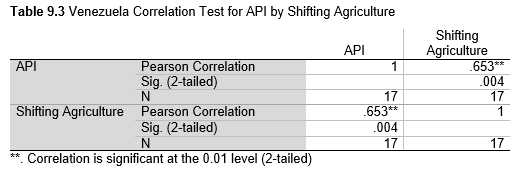
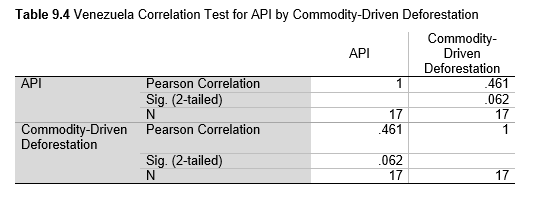
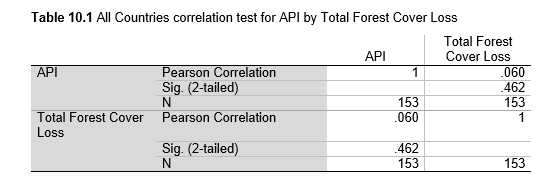
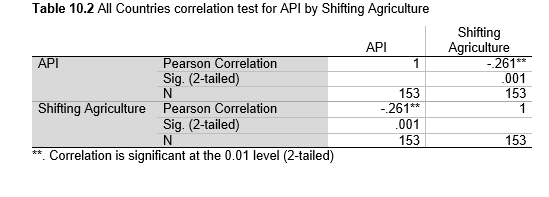
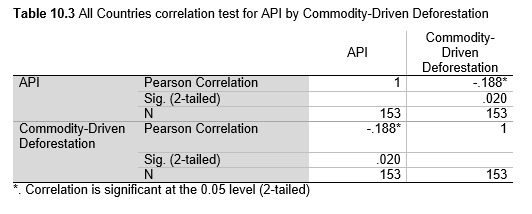
Next, Brazil was studied to determine whether greater deforestation results in higher levels of malaria. In Table 1.4, Pearson’s correlation is r = .63, p. < .001, supporting the hypothesis. Table 10.1 shows the combined countries test for Forest Cover Loss and API which has an r = .06 and is insignificant. Table 10.2 shows the combined countries correlation test for Shifting Agriculture and API with r = -.26, p. < .01. Table 10.3 measures the correlation for all the countries for Commodity-Driven Deforestation and API with r = -.19, p. < .05. Individual countries with significant correlations for Shifting Agriculture include Guyana (r = -.51, p. < .05, Table 6.3), Peru (r = -.51, p. < .05, Table 7.3), Suriname (r = -.59, p. < .05, Table 8.3), and Venezuela (r = .65, p. < .01, Table 9.3). Countries with significant correlations for Commodity-Driven Deforestation include Bolivia (r = -.50, p. < .05, Table 2.4), French Guiana (r = -.52, p. < .05, Table 5.4), Peru (r = -.54, p. < .05, Table 7.4), and Suriname (r = -.61, p. < .01, Table 8.4).
Discussion
The purpose of this research was to see if national deforestation and malaria rates are correlated. Overall, the results are mixed, with support for Brazil but not the other countries. Firstly, looking at the API trends, most of the countries started with high API values at the beginning of 2001 which suggests prevalent malaria risk factors that were not examined in this study. This is especially true for smaller countries like French Guiana, Guyana, and Suriname. These countries had more significant values for the analysis between API and Shifting Agriculture and Commodity-Driven Deforestation than others, with mostly negative correlations; however, these countries also had the least amount of forest loss. As the population size is smaller in these countries, outbreaks for one reason or another would more heavily impact their APIs, leading to the significant strong negative correlations in Tables 5.4, 6.3, 8.3, 8.4. For this reason, it is likely that the most significant malaria risk factors in these countries is not deforestation, and therefore the relationship examined in this study for these smaller countries is less meaningful than countries more heavily affected by deforestation.
We can see the difference in Forest Cover Loss, Shifting Agriculture, and Commodity-Driven Deforestation in figures 2.1-2.5. Brazil is the highest in each category, responsible for over 60-86% of the total Forest Cover Loss for all the countries in the time period studied. This is one reason that in Table 1.4 and Figure 1.1, the results suggest that there is a highly significant national correlation between Deforestation and API in Brazil specifically.
There are some limitations to the analysis I conducted, with key limitations being the small sample sizes and single method of analysis. Results might have been stronger had there been a bigger time period observed. This likely a reason that the correlation between Brazil and Deforestation (Table 1.4) was most significant (p. < .001).One of the implications of this research is that in order for deforestation in the Amazon to affect the API rates for the whole country and not just smaller regions on the frontier, there must be a high amount of deforestation. This project proposes that currently Brazil is the only country with high enough levels of deforestation to be connected with national API. Future work could focus on the API rates in frontier communities compared to other communities farther from the forest fringe. In this research, one would be able to establish how far from the forest fringe one must live before they are not as heavily impacted by deforestation driven malaria. This would in turn allow us to better understand the relationship between deforestation and malaria transmission as a whole. In addition, further research is needed to examine the relationships between Forest Cover Loss and API when deforestation first started to industrialize and grow at a larger scale. This research is necessary because presently there is not a great fluctuation or increase in deforestation on an annual basis, as there was when deforestation started. Because of this, the effects may be less noticeable. If data from the beginning of deforestation in each country is found, then it would be easier to examine the relationships between the two variables.
References
Austin, Kemen G., et al. “Trends in Size of Tropical Deforestation Events Signal Increasing Dominance of Industrial-Scale Drivers.” Environmental Research Letters, vol. 12, no. 5, IOP Publishing, May 2017, p. 054009. iopscience.iop.org, doi:10.1088/1748-9326/aa6a88.
Castro, Marcia Caldas de, et al. “Malaria Risk on the Amazon Frontier.” Proceedings of the National Academy of Sciences, vol. 103, no. 7, National Academy of Sciences, Feb. 2006, pp. 2452–57. www.pnas.org, doi:10.1073/pnas.0510576103.
Chaves, Leonardo Suveges Moreira, et al. “Global Consumption and International Trade in Deforestation-Associated Commodities Could Influence Malaria Risk.” Nature Communications, vol. 11, no. 1, 1, Nature Publishing Group, Mar. 2020, p. 1258. www.nature.com, doi:10.1038/s41467-020-14954-1.
Foley, Jonathan A., et al. “Global Consequences of Land Use.” Science, vol. 309, no. 5734, American Association for the Advancement of Science, July 2005, pp. 570–74. science.sciencemag.org, doi:10.1126/science.1111772.
Harris, Angela F., et al. “Biting Time of Anopheles Darlingi in the Bolivian Amazon and Implications for Control of Malaria.” Transactions of The Royal Society of Tropical Medicine and Hygiene, vol. 100, no. 1, Jan. 2006, pp. 45–47. Silverchair, doi:10.1016/j.trstmh.2005.07.001.
Hiwat, Hélène, and Gustavo Bretas. “Ecology of Anopheles Darlingi Root with Respect to Vector Importance: A Review.” Parasites & Vectors, vol. 4, no. 1, Sept. 2011, p. 177. Springer Link, doi:10.1186/1756-3305-4-177.
MacDonald, Andrew J., and Erin A. Mordecai. “Amazon Deforestation Drives Malaria Transmission, and Malaria Burden Reduces Forest Clearing.” Proceedings of the National Academy of Sciences, vol. 116, no. 44, National Academy of Sciences, Oct. 2019, pp. 22212–18. www.pnas.org, doi:10.1073/pnas.1905315116.
Marinotti, Osvaldo, et al. “The Genome of Anopheles Darlingi , the Main Neotropical Malaria Vector.” Nucleic Acids Research, vol. 41, no. 15, Aug. 2013, pp. 7387–400. Silverchair, doi:10.1093/nar/gkt484.
Nobre, Carlos A., et al. “Land-Use and Climate Change Risks in the Amazon and the Need of a Novel Sustainable Development Paradigm.” Proceedings of the National Academy of Sciences, vol. 113, no. 39, National Academy of Sciences, Sept. 2016, pp. 10759–68. www.pnas.org, doi:10.1073/pnas.1605516113.
Oliveira-Ferreira, Joseli, et al. “Malaria in Brazil: An Overview.” Malaria Journal, vol. 9, no. 1, Apr. 2010, p. 115. Springer Link, doi:10.1186/1475-2875-9-115.
Patz, J. A., and S. H. Olson. “Malaria Risk and Temperature: Influences from Global Climate Change and Local Land Use Practices.” Proceedings of the National Academy of Sciences, vol. 103, no. 15, Apr. 2006, pp. 5635–36. DOI.org (Crossref), doi:10.1073/pnas.0601493103.
Patz Jonathan A., et al. “Unhealthy Landscapes: Policy Recommendations on Land Use Change and Infectious Disease Emergence.” Environmental Health Perspectives, vol. 112, no. 10, Environmental Health Perspectives, July 2004, pp. 1092–98. ehp.niehs.nih.gov (Atypon), doi:10.1289/ehp.6877.
Smith, David L., et al. 7 | MEASURING MAL ARIA FOR ELIMINATION. p. 19.
Tilman, David, et al. “Global Food Demand and the Sustainable Intensification of Agriculture.” Proceedings of the National Academy of Sciences, vol. 108, no. 50, Dec. 2011, p. 20260, doi:10.1073/pnas.1116437108.
Vittor, Amy, et al. “The Effect of Deforestation on the Human-Biting Rate of Anopheles Darlingi, the Primary Vector of Falciparum Malaria in the Peruvian Amazon.” The American Journal of Tropical Medicine and Hygiene, vol. 74, Feb. 2006, pp. 3–11. ResearchGate, doi:10.4269/ajtmh.2006.74.3.
Vittor, Amy Y., et al. “Linking Deforestation to Malaria in the Amazon: Characterization of the Breeding Habitat of the Principal Malaria Vector, Anopheles Darlingi.” The American Journal of Tropical Medicine and Hygiene, vol. 81, no. 1, July 2009, pp. 5–12.
WHO_DCO_WHD_2014.1_eng.Pdf. https://apps.who.int/iris/bitstream/handle/10665/111008/WHO_DCO_WHD_2014.1_eng.pdf. Accessed 12 Apr. 2021.
Supplementary information
Calculations
API = (confirmed cases during 1 year/population in defined region) x 1,000
Data Collection
Population data was gathered from the United Nations Population Division and Department of Economic and Social Affairs, and is measured in the thousands. The malaria cases were collected from Pan American Health Organization (PAHO) a part of the World Health Organization (WHO). The data was collected as part of the Annual Country Reports to PAHO.
The Total Forest Cover Loss, Commodity-Driven Deforestation, and Shifting Agriculture data was found in Global Forest Watch. The tree cover loss data set is made in collaboration with the University of Maryland, Google USGS, and Nasa. It uses Landsat satellite images to map the yearly tree cover loss (Hansen et al.). The decision to download the data set from Global Forest Watch and not the original source was made because reading the original Landsat composites and computing the tree loss per year would have taken longer than the time frame for this project. These data sets were used for all the countries for the years 2001-2017. Tree Cover Loss includes removal of tree cover canopy at the landsat pixel scale and is often the result of human activities including forestry practices (timber harvesting or deforestation) as well as natural causes (disease or storm damage), and natural and human-induced fires. An objective of this project was to specifically focus on human influence on the environments so two additional data sets were collected from Global Forest Watch. Commodity-Driven Deforestation is one of the dominant drivers of tree cover loss, and is a permanent form of deforestation, linked primarily to commercial agricultural expansion. Shifting Agriculture is another dominant driver of deforestation in the Amazon and typically results in either temporary loss or permanent deforestation (Hansen et al.).
The Brazil Deforestation
Data used in Table 1.3 is measured by the National Institute for Space Research
(INPE) using the DETER and DETER-B systems of tracking. As it is a National
system this method was not available for other countries, but gave more years
of data for the nation with the most Deforestation (out of those measured in
this project). The data was retrieved from Mongabay (“What’s
the Deforestation Rate in the Amazon?”).
Tables
Figures
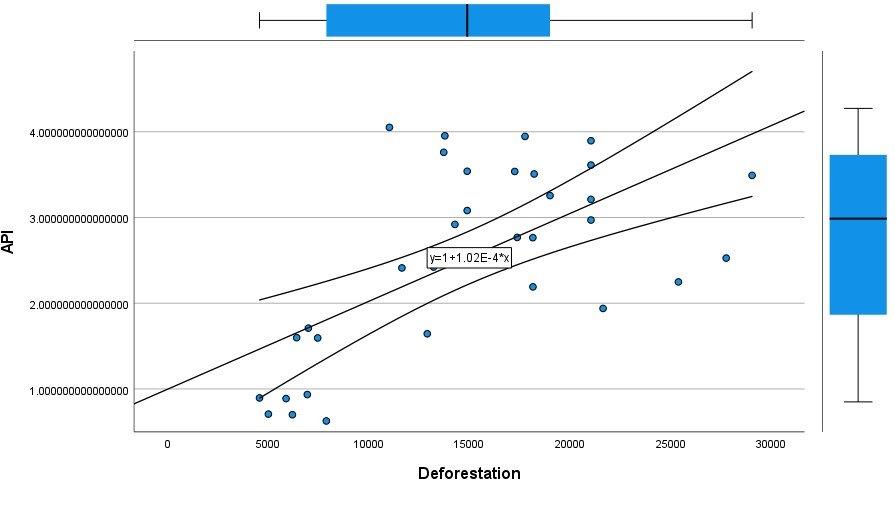
Figure 1.1 Scatterplot for Brazil for API by Deforestation
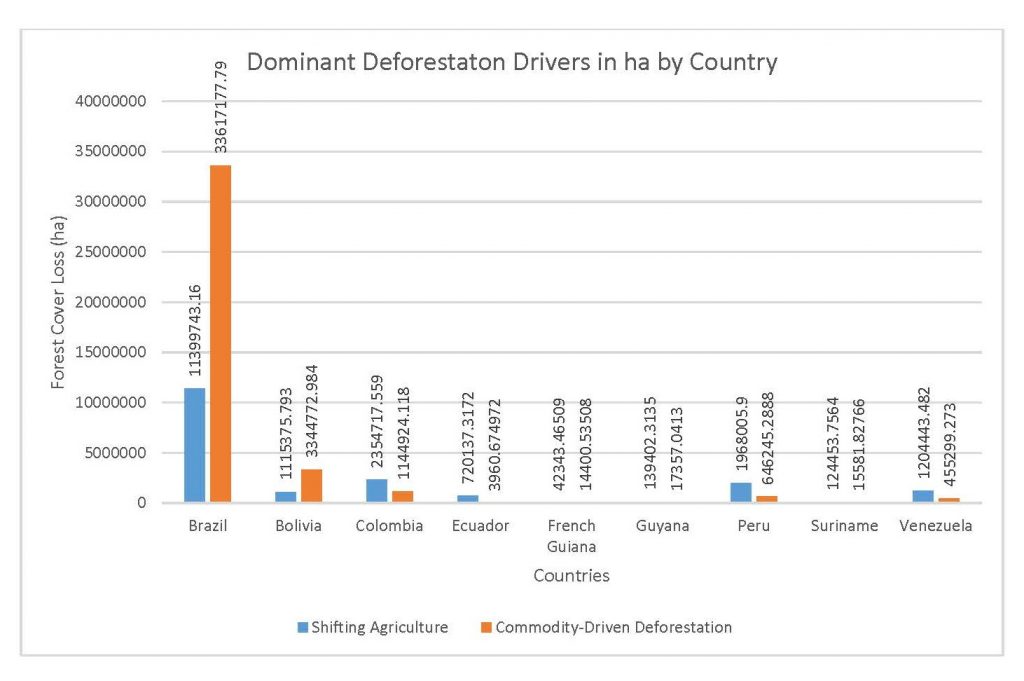
Figure 2.1 Dominant Deforestation Drivers in ha by Country

Figure 2.2 Forest Cover Loss in ha by Country
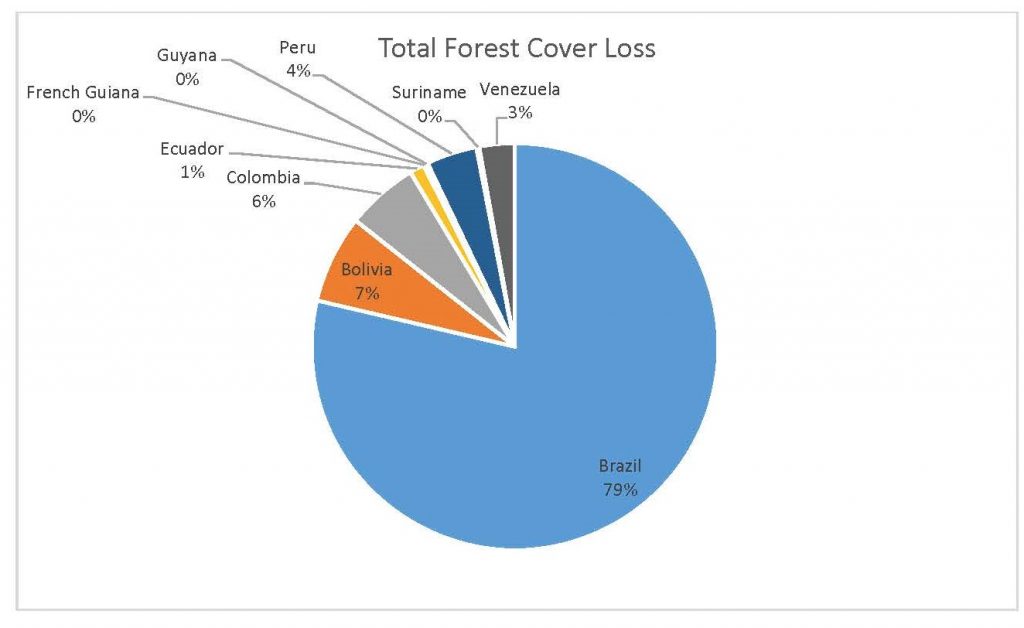
Figure 2.3 Total Forest Cover Loss by Country

Figure 2.4 Shifting Agriculture Percent by Country

Figure 2.5 Commodity-Driven Deforestation by Country
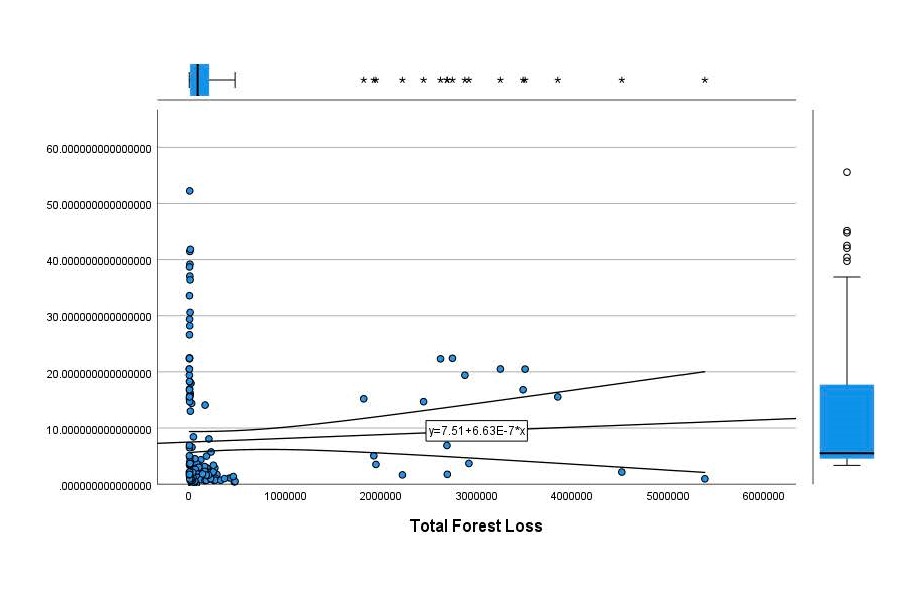
Figure 2.6 All Countries Scatterplot of API by Total Deforestation