Jennifer Zhang, Year 3
Abstract
Finding materials to absorb more noise is important because noise can cause a severe impact on people’s physical and mental conditions. My research question is how do surfaces shapes and materials’ placement affect sound absorption? Three different surfaces (flat, circular, triangular) and eight different placements (1, 2O, 2L, 2J, 3C, 3U, 3), 4) of porous material -acoustic foam – were chosen to test at respectively six and three frequencies. Both factors are suggested to have a minor influence on sound absorption. Comparing the two factors, the shapes factor displays a greater effect on sound absorption. Further studies can investigate the explanation behind this situation.
Introduction
The trend in sound absorption research is to improve on the existing porous materials’ sound absorption ability. Two important aspects regarding sound absorption are the environment and material. So, one stream of research places emphasis on finding/developing existing sound absorbing material in different mediums, for instance, underwater (Fu et. al 2021). On the other hand, some research emphasizes modifying the existing sound absorbing materials to improve its sound-absorbing ability (Gao et. al 2021). This work is determining plausible significant factors in sound absorption, which is the foundation to designing better sound-absorbing materials.
This study is a follow-up on an investigation of whether sound intensity affects the sound-absorbing material’s effectiveness (Zhang 2020). Although sound intensity does not affect the material’s effectiveness, the study suggests that a material’s porosity and surface shape irregularity do affect the sound-absorbing ability. As a continuation of the study, the surface shape irregularity was chosen while porosity was not chosen due to supply limitation. Moreover, the placement of the sound-absorbing material was added as the last study exhibited some perplexing yet interesting phenomena – the addition of sound absorbing material decreases the effectiveness. So, the research question for this study is how do surface shapes and materials’ placement affect sound absorption? The field of sound absorption emerges from the demand to listen to wanted sound better. So, the next step to extract the wanted sound is to filter out the unwanted sound, usually called noise. People often find the noise annoying to deal with especially in gathering situations. Noise can also cause physical and mental harm. One study illustrates how certain noise can cause detrimental hearing loss (Hohmann 2015). Another study reveals how noise can also limit people’s performances due to stress (Szalma 2011).
Materials and Methods
In this experiment, decibels with A-weighting (dBA) are used to measure sound intensity because the A-weighting is tweaked to how the sound is perceived by human ears. Since human ears are less sensitive to extreme frequencies, the A-weight shows the sound intensity level to be lower. (Wolfe, “dB: What is a decibel?”).
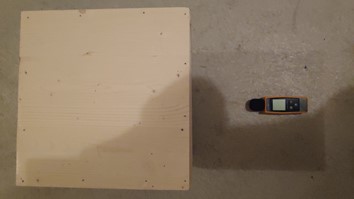
Figure 1: Overhead View of Set-Up
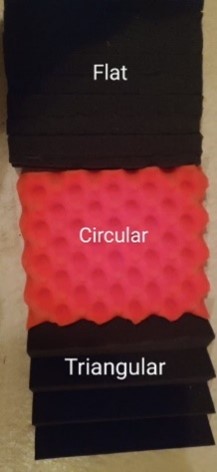
Figure 2: Diagram for shapes along with the notations
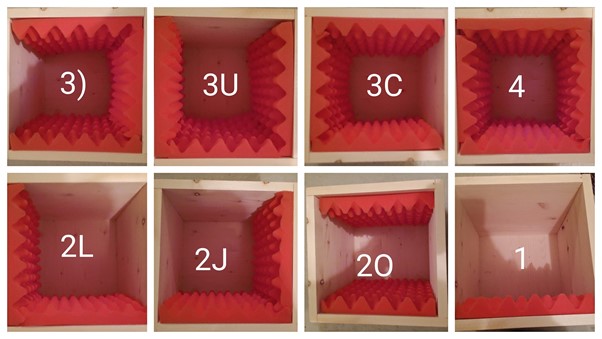
Figure 3: Diagram for placements along with the notations
There were two sets of experiments in this study, one for shapes and the other for placement. In the first experiment, the sound absorption of different acoustic foam shapes was tested at several frequencies. Three shape samples (Figure 2) were chosen: flat (Arrowzoom-wedge), circular (Arrowzoom-egg crate), and triangular (Arrowzoom-wedge). Modifications were made to the wedge variation into the flat variation. Two sets of stacked wedge foams were positioned such that the teeth were lined up (flat portion was exposed) and marked halfway on the teeth side. They were cut accordingly to the mark down the foam, then the cut peaks were pasted and secured into the foams’ trough. Six sound frequencies were chosen at 100 Hertz, 200 Hertz, 500 Hertz, 600 Hertz, 1500 Hertz, 2000 Hertz based on the range of common noise.
An open lid cubic box with an outer dimension length of 30.0 cm was built using 2.0 cm thickness lumber (Canfor). The sound intensity level was fixed within each distinctive frequency measurement. All material sample pieces had a dimension of 25.7 cm*25.7 cm *2.3 cm and were placed on each side of the cubic box and remained there. The ULKTL380 decibel meter device (LiNKFOR) was placed and fixed at the designated spot – 25 cm away from the nearest box’s side (Figure 1). The control measurement was read from the decibel meter device and settled to less than ∓ 1.5 dBA (device accuracy) difference compared to the recorded control. Next, the box was flipped upside down (covering the sound source) which was still situated at the midway between the sound source and measurement device. The data was read from the display once the number stabilized for more than three seconds to be considered as a valid measurement since there was not a reference to compare to. Then the measurement procedure was repeated two more times. After these three measurements in 100 Hertz, the measurement procedure was repeated with 200 Hertz, 500 Hertz, 600 Hertz, 1500 Hertz, 2000 Hertz. Next, all the decibel measurements were repeated with each surface shapes (including control). In the second experiment, the sound absorption of different acoustic foam placements was tested at three frequencies. Seven placement samples from circular foams were chosen: 1, 2O, 2L, 2J, 3C, 3U, and 3) (figure 3). Three sound frequencies were chosen at 100 Hertz, 500 Hertz, 1500 Hertz based on the range of common noise. The same measurement procedure took place.
Results
Table 1: the sound intensity reduction percentage for three different surface shapes at six different frequencies in three trials
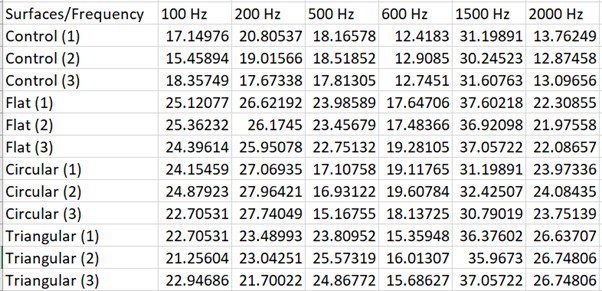
To compare the ability to absorb sound quantitatively, a reduction percentage is used. The method to find reduction percentage is:
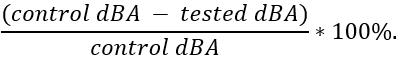
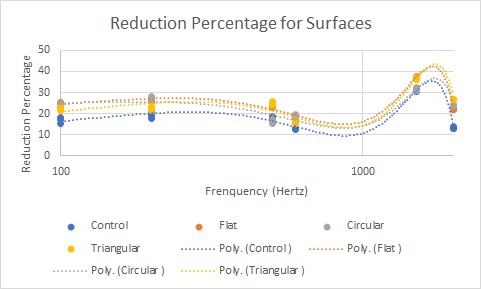
Figure 4: Graph of Reduction Percentage in Surfaces
Using the reduction percentage data above, figure 4 shows the reduction percentage grouped by surface types and compared against the frequencies. The horizontal x-axis, representing the frequency, is on a logarithmic scale of base 10. On average, 1500 Hertz has the highest absorption percentage while 600 Hertz has the lowest absorption percentage. The majority of the data points are in the range of 10% to 40%. It has an overall trend of mid effectiveness in low range, low effectiveness in mid-range, high to mid effectiveness in high range. Also, the trendline shapes are similar across the different surface types. The points appear to be clustered together, but the effect of shape and frequency on sound absorption have a statistical significance in one way ANOVA test.
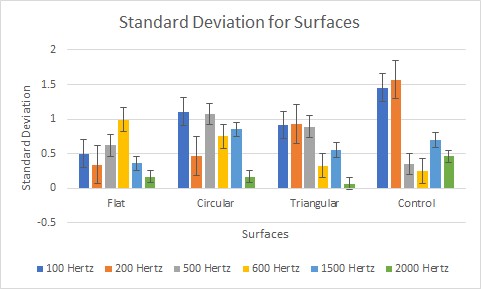
Figure 5: Graph of Standard Deviation in Surfaces
Figure 5 shows the standard deviation of the reduction percentage across the different categories grouped by surface types and frequency. Standard deviation is used as a way to rank consistency. On average the flat type is the most consistent while the circular and triangular types are around the same.
Placements
Table 2: Reduction Percentage in the placement experiment
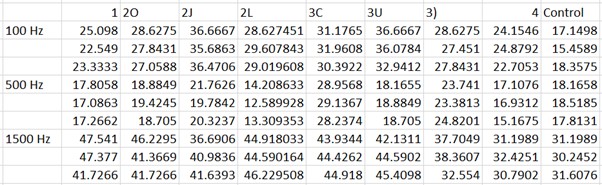
Table 2 shows the sound intensity reduction percentage for eight different surface placements at three different frequencies in three trials.
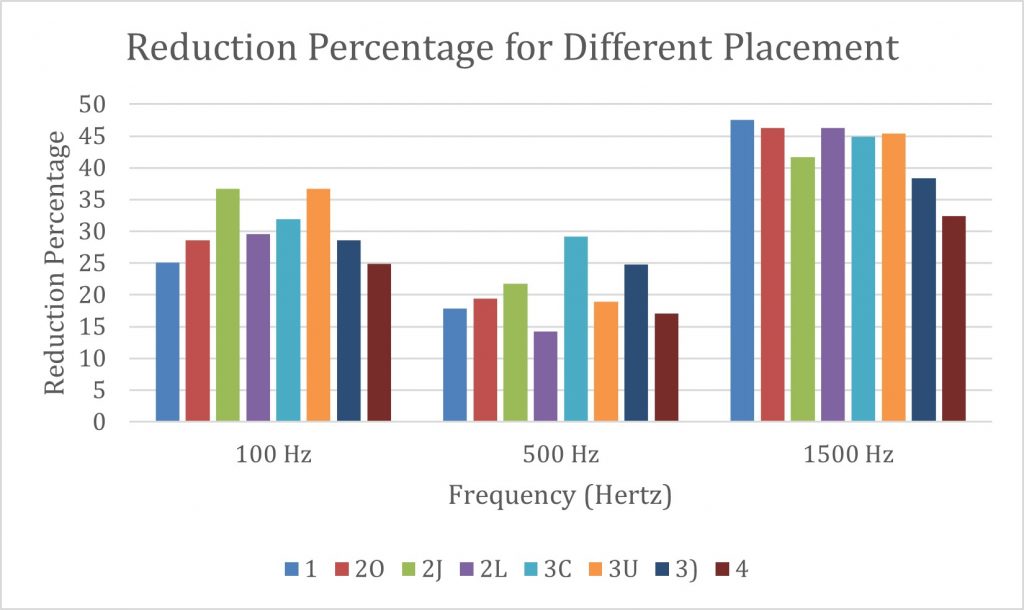
Figure 6: Graph of Reduction Percentage in Placement
Using the reduction percentage data above, figure 6 shows the reduction percentage grouped by placement types and frequencies. The horizontal x-axis, representing the frequency, is organized in increasing order. On average, 1500 Hertz on has the highest absorption percentage while 500 Hz on average has the lowest absorption percentage. In frequency groups, the placement(s) that have a relativity high reduction percentage are 2J and 3U for 100 Hertz; 3C for 500 Hertz; 1, 2O, 2L, 3C, and 3U for 1500 Hertz. The majority of the data points are in the range of 10% to 50%. The points appear to be clustered together, but the effect of placement and frequency on sound absorption have a statistical significance in one way ANOVA test.
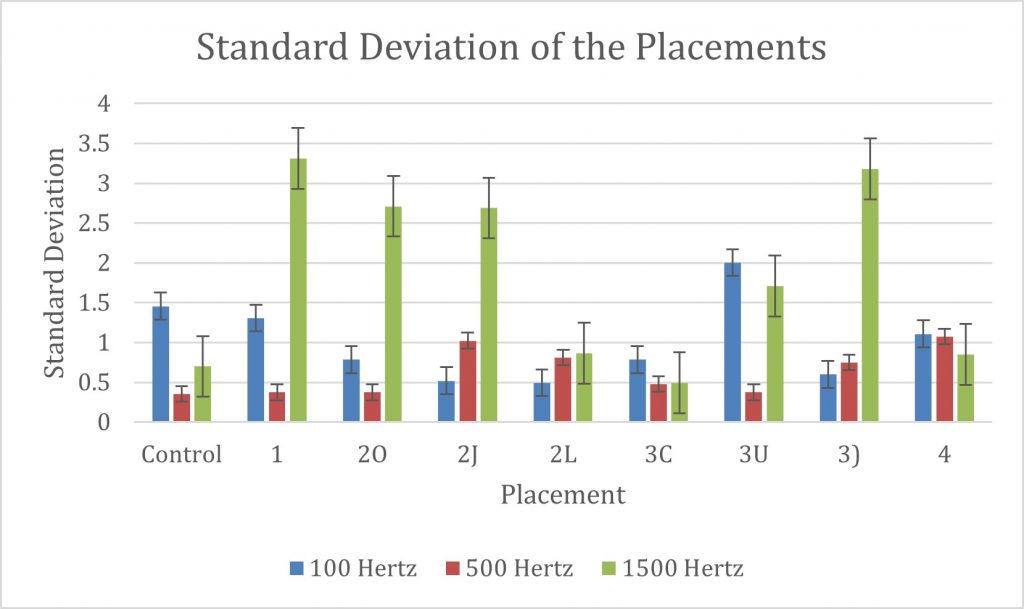
Figure 7: Graph of Standard Deviation in Placement
Figure 7 shows the standard deviation of the reduction percentage across the different categories grouped by placement types. Overall the 2L, 3C, and 4 are the most consistent while the rest have a high standard deviation at 1500 Hertz.
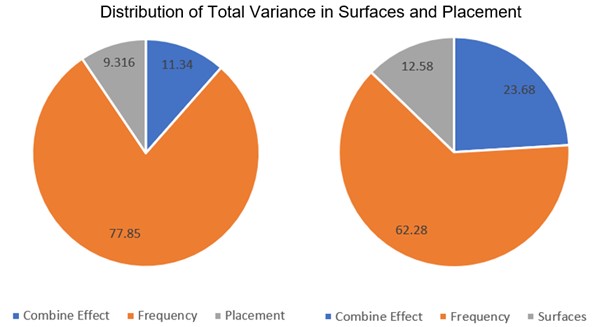
Figure 8: Pie charts of the distribution of total variance in Surfaces and Placements
The data in figure 8 was obtained in two separate two-way ANOVA analyses comparing the effect of placements with frequencies and surfaces with frequencies. Since the two experiments included different frequencies, only data from the common frequencies data were taken into consideration. For both pie charts, frequency dominates in affecting the sound absorption. On the other hand, surface shapes have a greater combined and individual effect.
Discussion
There were some unexpected results in the 500 Hertz tests. One of them is in the shapes test where the addition of circular foam did not improve the reduction percentage. Despite that, the addition of foam increases the reduction percentage by about 47% on average. The other unexpected result was in the placements test where the control was better than 2L.
Even though the results show surface shapes and placements did not make a drastic impact compared to frequency on sound absorption (refer to Figure 8), the two ANOVA tests show that the effects of shape and placement are statistically significant, which suggested them as factors that make a difference. Since frequency accounts for the majority of the sound intensity reduction percentage variance, the patterns for surface and placement factors are not clearly displayed in the trend. Minor variation in these two tested factors also suggested that there are more important factors, such as material thickness and porosity (Amares et al. 2017).
One plausible limitation to my experiment is the box’s size was not big enough for the sound to undergo the full cycle. In other tests (Adams 2016), they had performed experiments using a regular-sized room setting. With this condition, a trend of positive correlation between foam’s absorption and frequency is established.
Another condition difference may lead to a discrepancy in the mid-range frequency result, revealing an explanation to the abnormality. Since the controlled environment’s material is different -concrete/brick and pinewood – the difference between the controlled material may cause the discrepancy. Following this line of reasoning, it implies that pine wood has better sound absorption than concrete/brick at the mid-range frequency (Urban Acoustics: “Noise Reduction Coefficient (NRC)”). On the chart, all variations of concrete or brick are lower than the wood absorption coefficient. This particular chart is supporting the difference in control hypothesis.
On the other hand, strictly looking at the result with the current experiment context, it proposes the hypothesis of wood absorbing better than acoustic foam in mid-range. Other studies (Smardzewski et al. 2015) (Tiuc et al. 2015) indicate the two materials have around the same effectiveness around the mid-frequency range. As a result, it makes the current mid-frequency test result less indicative because foam becomes a minor factor. Although the more expected trend carries onto the low-frequency range, the combined effect of wood and foam results in higher absorption effectiveness than mid-range. This effect needs further studies to investigate the trend and reasoning.
Additionally, the trendline illustrates the frequency’s effect predicting a trough around 800 Hertz and a peak around 1200 Hertz. One study (Dib et al. 2015) shows the opposite while another (Tiuc et al. 2015) shows some similarities in the high-frequency range. Excluding the effect from set up, their main difference is density. That study also (Dib et al. 2015) exhibits density being an important factor causing noticeable changes.
The sources of error could come from not keeping moisture (media density) and temperature in control as these two factors are governing how sound travels (Chelidze, 2018) along with sound intensity. In fact, most studies use sound absorption coefficient which is defined as absorbed energy over incident energy. The other source of error is the measurement device (∓ 1.5 dBA). Even though the decibel level was not constant for all tested trials, the decibel level does not affect sound absorption as the reduction percentage is the same.
Most importantly, this study raises some questions for further studies such as why is surface more important than placements? What makes a particular placement effective versus not effective?
References
Adams, Tyler. Sound Materials: a Compendium of Sound Absorbing Materials for Architecture and Design. Frame Publishers, 2016, Google Books, books.google.ca/books?id=Nb5pjwEACAAJ&printsec=frontcover#v=onepage&q=slow%20sound%20phenomena&f=false.
Amares, S, et al. “A Review: Characteristics of Noise Absorption Material.” Journal of Physics: Conference Series, vol. 908, 2017, p. 012005., doi:10.1088/1742-6596/908/1/012005.
Chelidze, Merab. “A New Simple Method for Determining the Sound Absorption Coefficient.” MATEC Web of Conferences, vol. 211, 2018, p. 04003., doi:10.1051/matecconf/201821104003.
Dib, Lyes, et al. “Mechanical Parameters Effects on Acoustic Absorption at Polymer Foam.” Advances in Materials Science and Engineering, vol. 2015, 2015, pp. 1–10., doi:10.1155/2015/896035.
Fu, Yifeng, et al. “Underwater Sound Absorption Properties of Polydimethylsiloxane/Carbon Nanotube Composites with Steel Plate Backing.” Applied Acoustics, vol. 171, 2021, p. 107668., doi:10.1016/j.apacoust.2020.107668.
Gao, Nansha, et al. “Design, Fabrication and Sound Absorption Test of Composite Porous Metamaterial with Embedding I-Plates into Porous Polyurethane Sponge.” Applied Acoustics, vol. 175, 2021, p. 107845., doi:10.1016/j.apacoust.2020.107845.
Hohmann, Beat W.. “Assessment of Impulse Noise regarding Harmfulness to Hearing.” (2015).
“Noise Reduction Coefficient (NRC) .” Highway Noise Pollution Migitation Design Systems. Conceptual & Performance Driven Design Shenkar College, Israel, 2009.
Smardzewski, Jerzy, et al. “Sound Absorption of Wood-Based Materials.” Holzforschung, vol. 69, no. 4, 2015, pp. 431–439., doi:10.1515/hf-2014-0114.
Szalma, James L., and Peter A. Hancock. “Noise Effects on Human Performance: A Meta-Analytic Synthesis.” Psychological Bulletin, vol. 137, no. 4, 2011, pp. 682–707., doi:10.1037/a0023987.
Tiuc, Ancuţa-Elena, et al. “Improved Sound Absorption Properties of Polyurethane Foam Mixed with Textile Waste.” Energy Procedia, vol. 85, 2016, pp. 559–565., doi:10.1016/j.egypro.2015.12.245.
Wolfe, Joe. “DB: What Is a Decibel?” Physclips, www.animations.physics.unsw.edu.au/jw/dB.htm.