Xavier Lam, Year 3
Abstract
Skin cancer is one of the most common forms of cancer and is often fatal when diagnosed late. However, with early detection the five year survival rate is 99%. Sometimes, skin cancer is hard to detect, and people may dismiss a dangerous form of melanoma as a non-cancerous mole. A deep learning image classifier could assist dermatologists and GPs in diagnosis and allow for more affordable and accessible forms of detection. Using a dataset consisting of 10000 labelled skin lesion images, convolutional neural networks were trained to create an image classifier to recognize 9 different classes of skin lesions. After running training sweeps to find optimal hyperparameters, the best model is evaluated using cross validation. This model attained a promising accuracy comparable to accuracy of dermatologists and GPs. Further work can be done to combat overfitting and class imbalance and improve accuracy.
Introduction
Skin cancer is one of the most common forms of cancer, affecting one in five people in America (The Skin Cancer Foundation 2021). Specifically, stage IV melanoma is the deadliest form of all skin cancers (American Cancer Society 2014). Many people are not diagnosed until fatal stages when other symptoms appear, and the cancer has already spread to vital areas such as the lymph nodes, lungs and brain. Sometimes, skin cancer is hard to detect, and people may dismiss a dangerous form of melanoma as a non-cancerous mole. However, with early detection the five year survival rate is 99%. Often, skin cancer screenings involve dermatologist appointments, or a biopsy can be performed to more accurately diagnose skin cancer from a skin sample. However, there is current hesitancy to visit a clinical setting because of COVID pandemic concerns (Kalter 2021). Screenings look for new moles, pimples that have been around for 6-8 weeks, or moles that were once round and are now oddly shaped or have changed colour.
Deep learning (a subfield of machine learning) is becoming a powerful tool for image classification (M.V. Valueva 2020). Artificial neural networks (ANNs) are computing systems loosely inspired by the biological brain (S. Agatonovic-Kustrin 2000). ANNs consist of many artificial neurons, and gather knowledge by learning patterns in data through experience. Each artificial neuron is a node which connects to other neurons and have coefficients (weights) that determine a node’s strength of influence on another; altogether these make up the neural network structure. Ultimately, the outputs of these neurons can accomplish tasks such as classifying images.
Deep convolutional neural networks (CNNs) are based on artificial neural networks and can distinguish between photos of multiple classes (Bengio 2009). A simple example would be a CNN trained to distinguish between dogs and cats. CNNs learn to optimize filters through automated learning, which can be advantageous over traditional human-engineered algorithms. Deep neural networks consist of multiple layers that take in raw input and progressively extract high-level features (Deng 2020). For instance, a lower layer can identify edges, while a higher layer can identify actual concepts such as digits or faces. This technology can aid in the diagnosis of melanoma through classification of skin lesions. Such technology can help provide a second opinion to those worried about a mole/lesion, or those hesitant to see a doctor during the pandemic.
Previous work by Stanford University (Esteva et al. 2017) has been done with deep learning to classify skin cancer that made use of the pretrained inception v3 model, which was originally trained to recognize general objects and was then trained to recognize skin lesions. However, a pre-trained model or transfer learning was not used for this project. Smartphone applications can provide medical technology conveniently in your pocket. For example, Freestyle Libre is an app which can monitor body glucose levels and send them to your phone (Freestyle). A CNN skin lesion classifier incorporated in a smartphone app could be accessible globally and aid areas that lack medical care.
Materials and Methods
An image dataset of 10000 pre-classified skin lesions was found online. The HAM10000 (Tschandl et al.) dataset from a Kaggle.com challenge was imported and used (Figure 1).
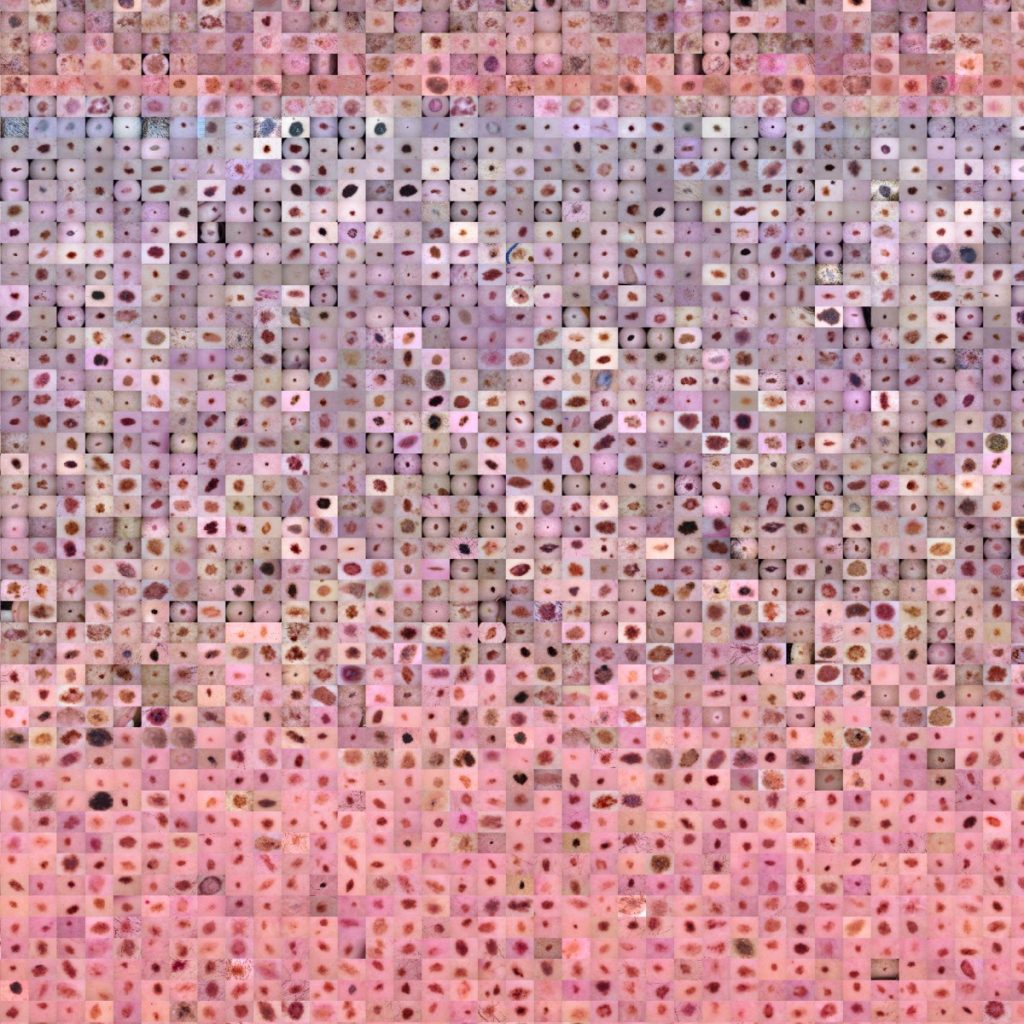
Figure 1: HAM10000 Dataset Images
The images are labelled with one of seven classes of skin lesions: actinic keratoses, basal cell carcinoma, benign keratosis-like lesions, dermatofibroma, melanocytic nevi, melanoma, and vascular lesions. Additionally, a Google Colaboratory notebook was set up to run Python code through the cloud. Image data was visualized and analyzed for quantity and imbalance of class population (Figure 2).
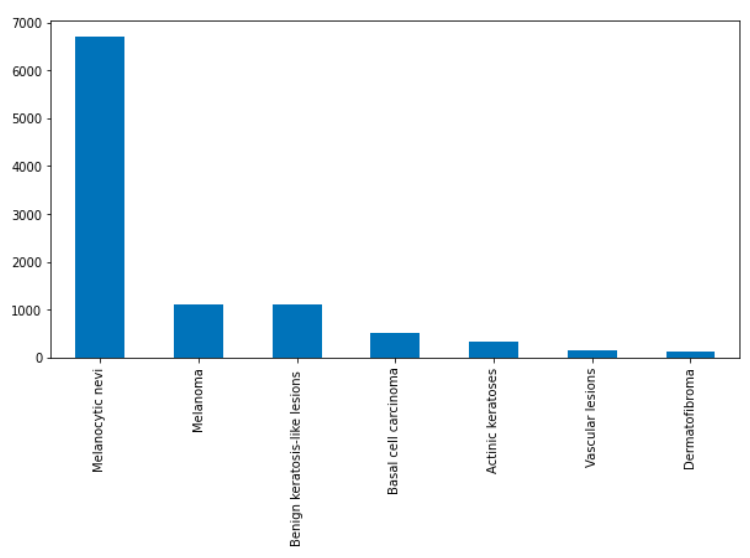
Figure 2: Image Class Distribution
Using the Keras library for Google’s Tensorflow, the sequential CNN architecture was created. The website Weights and Biases was used to log metrics and perform hyperparameter sweeps with the wandb Python library (Weights & Biases). Scikit-learn library modules were imported for generating metric reports and data splitting.
First, all images were resized from 800x600px to 64x64px, then split into a 80:20 ratio of testing data and training data of both image data (input, x) and label data (output, y). Image data was then normalized to improve performance (pixels rescaled so values are within 0 and 1), and labels are one-hot encoded. Early stopping code was incorporated for training models. To ensure an adequately performing model was chosen for each training run, the run would be automatically stopped after 20 epochs if no improvement was detected. Additionally, a dropout layer was added to the model after the first dense layer.
Hyperparameters sweeps were initialized and performed to search for optimal hyperparameters using Bayesian optimization and a maximum of 100 epochs. The parameters optimized were batch size (32, 64, 128, and 256), dropout (0.1, 0.2, 0.5), and learning rate (3e-4, 3e-5, 2e-5, 1e-5, 1e-6). For each training epoch, the training and validation accuracy/loss was logged. Accuracy represents the amount of correct classification out of the total amount of classifications. Training accuracy represents the accuracy of the model on images it was constructed on, and validation accuracy is the accuracy of the model on examples it hasn’t seen. Loss indicates the error of the model’s predictions. Training loss is the error on the training set of data. Validation loss is the error after running the validation set of data through the trained network. After each training run, the model was evaluated on the test data split, and the area under the receiver operating characteristic curve (ROC AUC) was taken from plotting the true positive rate against the false positive rate. These metrics were then logged using Weights and Biases. A 5 k-fold cross-validation run was performed using the best performing hyperparameters. Each of the 5 runs is evaluated for accuracy and ROC AUC, and the average across the 5 runs for each metric was taken. Additionally, a classification report with precision, recall, and f1-score across all classes is generated (Figure 5). (Precision is defined as the number of true positives over the number of true positives plus the number of false positives. Recall is defined as the number of true positives over the number of true positives plus the number of false negatives. Both quantities are also related to the F1-score, which is defined as the harmonic mean of precision and recall.) The ideal model will classify each image in the dataset correctly.
Results
After a hyperparameter sweep of 33 runs, the best run was selected. The following graphs are the accuracy and loss graphs of the run with final validation accuracy of 74.49% and the highest ROC AUC score of 0.91 on the test dataset. The parameters of the final model were batch size of 128, 0.5 dropout, 100 epochs, learning rate of 0.00001, with rmsprop optimizer.
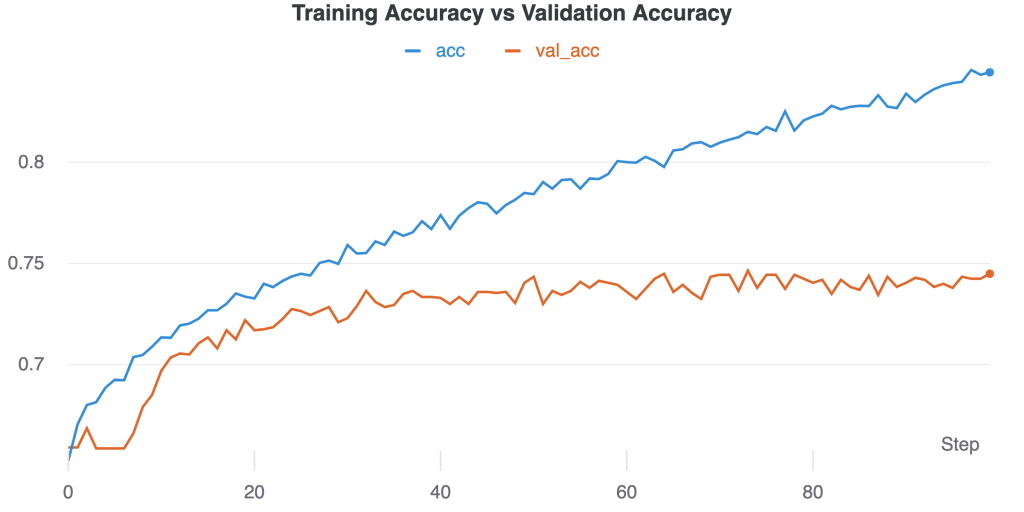
Figure 3: Training Accuracy vs Validation Accuracy over time (epochs/steps). Training accuracy continues to rise as validation begins to plateau at around 40 epochs.
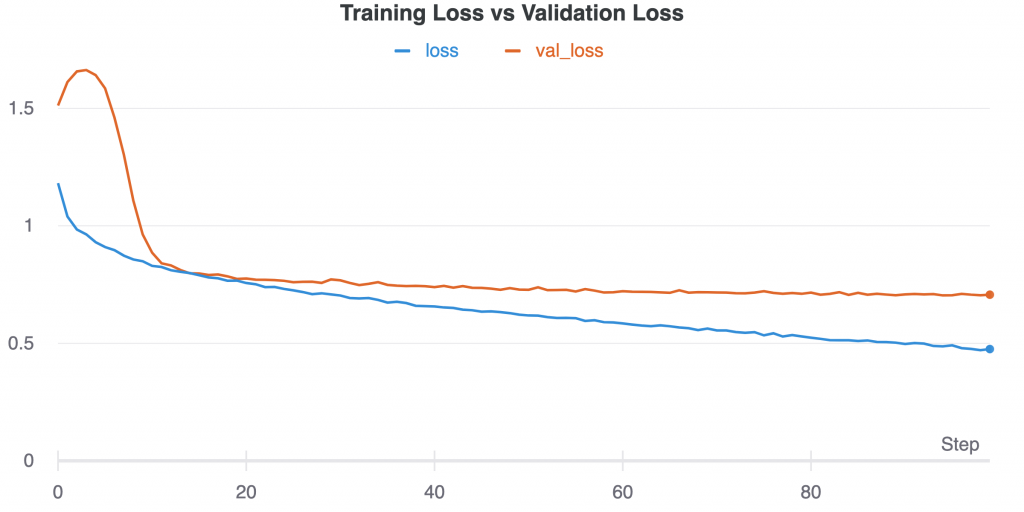
Figure 4: Training loss vs validation loss over time (epochs/steps)
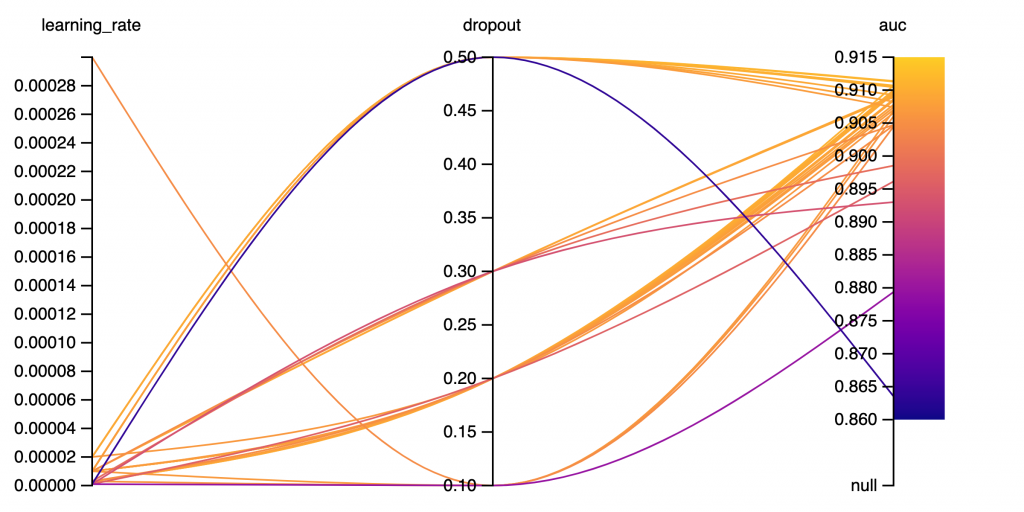
Figure 5: Graph depicting impact of learning rate and dropout on ROC AUC score. (33 runs) Lower learning rate with 0.5 dropout tended to produce higher auc scores. Dropout of 0.3 shows more variance in auc scores.
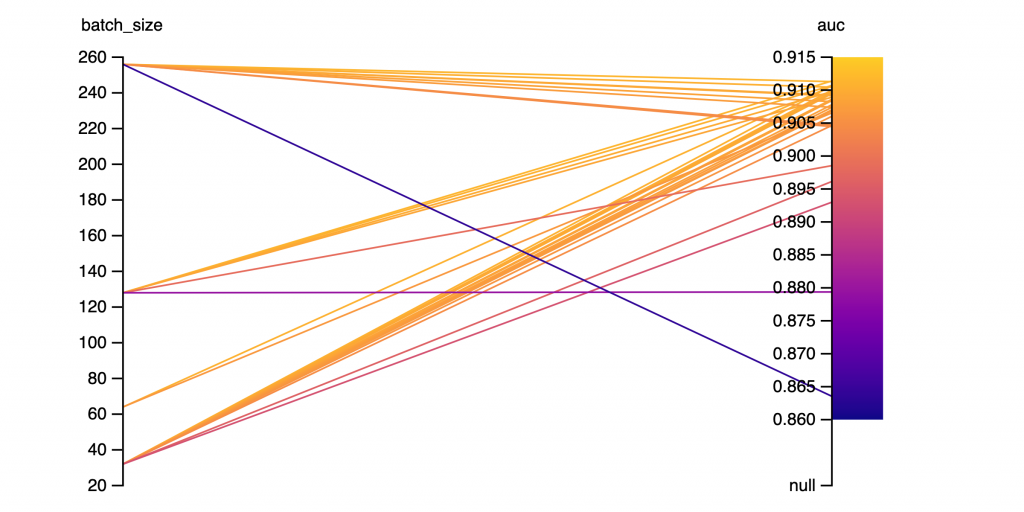
Figure 6: Batch Size and AUC SCORE. (33 runs)
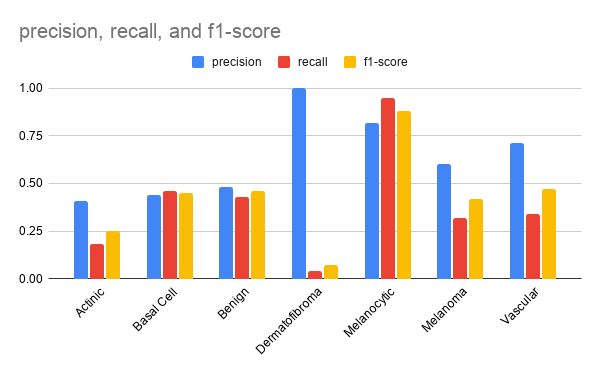
Figure 7: Precision, Recall, and F1-Score for each class of the best model evaluated on the test set.
The highest scoring class was melanocytic nevi with over 0.8 f1-score. The lowest scoring class was dermatofibroma with only 0.07 f1-score.
Discussion
Imbalanced class sizes was a prominent issue faced. For imbalanced datasets, accuracy is not always the best metric to base conclusions off. For example, if there were two classes in your test dataset, with 90 apples and 10 oranges, and your model classifies everything it sees as an apple. The accuracy would be 90% but is misleading since the model lacks the ability to distinguish between the two classes. In terms of my project, the final model’s accuracy of 74.49% was partially due to the large and disproportionate amount of ‘melanocytic nevi’ images that were classified. In future work, to combat an imbalanced dataset, random oversampling/undersampling could be incorporated. Random oversampling involves randomly selecting examples from a minority class to add to the training dataset and random undersampling involves randomly selecting examples from the majority class and deleting them from the training dataset. This could possibly fix class imbalance problems and raise accuracy.
Using other metrics such as ROC AUC (precision and recall) can give a better understanding of a model’s performance. The ROC AUC score is also useful for ranking models relative to each other and helping to select the hyperparameters for the best performing model. The hyperparameter results do not show a strong correlation between them, however a dropout of 0.5 with lower learning rates tended to consistently produce greater ROC AUC scores.
In the Stanford research paper (Esteva et al. 2017), similar work was done to classify skin lesions with transfer learning CNN’s. They had two dermatologists who were tasked with classifying various skin lesion types from the validation datasets. The first dataset contained three classes, and the second contained nine classes. The dermatologists both attained roughly 66% accuracy on the first and about 53.3% and 55.0% accuracy on the second, while their CNN model achieved 72.1% accuracy on the first and 55.4% accuracy on the second as well as ROC scores of over 0.91. A study from the UK (Pockney et al. 2009) showed that GPs failed to recognise one-third of the skin malignancies. Comparing dermatologist and general practitioner accuracy with my own model’s accuracy of 74.49% over 7 classes and taking for account that there is much room for improvement, it is still promising.
The resized 64x64px resolution was chosen due to restraints with Google Colab cloud computing/RAM limits. Since some lesions are similar in appearance, a lower resolution could be hard to classify correctly. Future improvements to accuracy could be made as a result of increasing the image resolution, as the CNN will be able to learn more details and features of the different image classes. However, compared to the original image size of 800x600px, a size of 64x64px is around 100 times smaller. Increasing image size could improve performance with a tradeoff of training time and required memory.
A common problem in deep learning is overfitting and underfitting. Essentially, overfitting is a modeling error that occurs when the function fits the training data points too closely and picks up unnecessary noise, and will therefore perform poorly on unseen data. Overfitting can be characterized by a very high training accuracy but low testing accuracy. Underfitting is when the model fails to learn from the training data, and is evident when training accuracy is low. Initially, my model was frequently overfitting. To combat overfitting, a dropout layer was added, which randomly ‘drops-out’ neurons and increases generalization. Presence of dropout showed improved scores, with 0.5 dropout producing the best results.
The goal of this project was to train a deep learning neural network to classify images of skin lesions. In the future, implementing this deep learning model into a smartphone app will allow for greater accessibility of this technology and will aid in places that lack affordable health care. Users could use the app along with a doctor screening to get a second opinion but should not solely rely on it. Further work will have to be done to create a more reliable model. More work on the model can be done to combat overfitting as well as class imbalance issues. Skin cancer accounts for ~ 35–45% of all neoplasms in Caucasians, 4–5% in Hispanics, 2–4% in Asians, and 1–2% in Blacks (Ridky, 2007). Additionally, melanoma in people of color most often occurs in areas that get little sun exposure, with up to 60 to 75 percent of tumors arising on the palms of the hands, soles of the feet and the nail areas (Gloster 2006) Skin tone or pigment was not taken into account and the HAM10000 dataset contained mostly images of light skin tone, thus future work could be done with varying skin colours.
References
Agatonovic-Kustrin, S. “Basic Concepts of Artificial Neural Network (ANN) Modeling and Its Application in Pharmaceutical Research.” ScienceDirect, 1 June 2000, www.sciencedirect.com/science/article/abs/pii/S0731708599002721.
American Cancer Society. Cancer facts & figures 2014. American Cancer Society, 2014.
Bengio, Yoshua. Learning Deep Architectures for AI (Foundations and Trends(r) in Machine Learning). Now Publishers Inc, 2009.
Deng, Li. “Deep Learning: Methods and Applications.” Microsoft Research, 18 Mar. 2020, www.microsoft.com/en-us/research/publication/deep-learning-methods-and-applications/?
Esteva, Andre. “The Final Frontier in Cancer Diagnosis.” Nature, 25 Jan. 2017, www.nature.com/articles/nature21056?
Freestyle. Abbott Digital Styleguide, www.freestyle.abbott/ca/en/products/libre.html.
Gloster HM, Neal K. Skin cancer in skin of color, J Am Acad Dermatol 2006.
Kalter, Lindsay. “Doctors Warn of Skin Cancer Screening Crisis.” WebMD, WebMD, 28 Jan. 2021, www.webmd.com/lung/news/20210128/doctors-warn-of-skin-cancer-screenin g-crisis.
Pockney, P. “Recognition of Skin Malignancy by General Practitioners: Observational Study Using Data from a Population-Based Randomised Controlled Trial.” PubMed Central (PMC), 13 Jan. 2009, www.ncbi.nlm.nih.gov/pmc/articles/PMC2634694.
Ridky TW. Non-melanoma skin cancer. Journal of the American Academy of Dermatology, 2007.
The Skin Cancer Foundation. “Skin Cancer Facts & Statistics.” The Skin Cancer Foundation, 1 Apr. 2021, www.skincancer.org/skin-cancer-information/skin-cancer-facts.
Tschandl, Philipp. “The HAM10000 Dataset, a Large Collection of Multi-Source Dermatoscopic Images of Common Pigmented Skin Lesions.” Scientific Data, 14 Aug. 2018, www.nature.com/articles/sdata2018161?error=cookies_not_supported&code =15362772-9897-4ffb-aefd-beef9367c972.
Valueva, M.V. “Application of the Residue Number System to Reduce Hardware Costs of the Convolutional Neural Network Implementation.” ScienceDirect, 1 Nov. 2020, www.sciencedirect.com/science/article/abs/pii/S0378475420301580?via%3Dihub.
Weights & Biases – Developer Tools for ML, wandb.ai/site.