Ewan Hadden, Alana Jungjohann, Ben Brink, Jack Hemsley, Elise Montgomery, Duncan Glave and Ben Macfarlane. West Vancouver Environmental Science Academy.
Abstract
The Environmental Science Academy spent 5 months from October 2019 – March 2020 focused on how the environment, economy, and human interactions impact the Chinook, Coho, Pink and Chum salmon populations along Hadden Creek and the watershed in Vancouver, B.C. Salmon are very important for the Greater Vancouver area and the province of B.C. as a whole. The academy used data from the Streamkeeper Foundation from the years 2006-2019, which is subject to error because it is collected by students and volunteers who have hands-on training from DFO protocol and standards. This study’s data exhibited a very large spike in salmon populations in 2015 followed by a significant decrease during later years. Salmon are essential to local communities as a nutritious source of food for the ecosystem and humans, they are a critical link between the oceanic and freshwater habitats, and a valuable international trading commodity. Natural and urban factors determine the population number and the health of the fish.
Introduction
For our lab, we focused on how the environment, economy and human interactions impact the salmon population along Hadden creek and the Watershed in Vancouver, BC. Salmon are vital for the greater Vancouver Area and the Okanagan Valley as they shape the people and places in British Columbia.
There are four different species of salmon found in British Comlumbia’s creeks, Chinook, Coho, Pink and Chum. Salmon fry spend most of their young lives in their natal creeks and streams because they are protected from predators under rocks and vegetation. After a couple of months, the matured salmon fry enter the oceanic environment through estuaries. Estuaries are important for their process called ‘smolting’ because it allows the salmon to gradually adjust to water with high salinity levels and a dense amount of predators. During the smolting process, the salmon develop colourful scales ranging from bright red to deep green. As they return in the ‘salmon runs’, you can see them clearly from cliff edges and bridges and this allows the other salmon to locate each other for mating. The data from Streamkeepers shows us that Chinook, Chum and Coho usually stay out at sea for about one year before returning to their natal streams for spawning versus the Pink salmon which return approximately every two to four years.
For this lab, we used that data from the Streamkeeper Foundation from the years 2006-2019. Streamkeepers Foundation was founded in May of 1995 as a non-profit society dedicated to support local communities. They were created as “an effort to support community volunteers who are interested in assessing, monitoring and improving their local waterways” (Streamkeepers, n.d). Data collection and Streamkeeper activities occur at specific months of the year because the program depends on the spawning, returning and smolting of the salmon. Stream restoration is another activity in which volunteers can sign up for; this work is crucial for the well-being of the salmon, and it assures the hope for the next generation of Salmon fry. Stream restoration is the process of clearing obstacles in the water and improving the health of the ecosystem in the creek or river where protecting the creek has failed before. This leads to more biodiversity, better landscape development and recreation of the streams for healthy spawning (U.S. Forest Service, n.d).
Annually, the Streamkeeper Foundation hosts salmon surveys up the Watershed and Hadden creek in West Vancouver. Students and volunteers record data for Streamkeepers, which allows the possibility for error to increase as we also noticed while interpreting the data for our graphs. Streamkeepers use Salmon Surveys as a way to record quantifying and quantity data. Salmon surveys are a way to track and record the number of salmon returning to their birth streams. The surveys ensure that the salmon are healthy and they record if the fish population increased or decreased. Scientists can then take the data and see if there are trends or patterns. Natural and urban factors determine the population number and the health of the fish. Some factors to why the salmon population is decreasing in Vancouver over the last decade is because of Shoreline influences such as: Sea levels rising, developments or residential areas move and pollute creeks and rivers essential to annual salmon runs, and intertidal salmon fry loose habitat due to pollution. Another factor to population decrease could be the increasing transportation of goods in the Port of Vancouver because transportation of one use plastics by tankers creates the possibility of oil spills, loose paint enters the environment, noise pollution from increasing transit, habitat destruction and turbulence from moving freighters. The extensive use of CO2 emissions as the city grows in population after 2010 as an increase in tourism also plays a factor in ocean pollution.
Salmon are essential for Vancouver’s environment, economy and social sector. Over 137 different species in our environment depend on salmon as a form of nutrition, and seafood, and salmon in the North Pacific created a $3 billion industry (BC Ministries, 2016). Thousands of jobs and local businesses and communities have been shaped into North America’s economy due to seafood production. Salmon connect the oceanic and freshwater habitats and are essential to the survival of rivers all along the lower mainland and the Fraser Valley. Salmon runs allow tons of marine nutrients from the ocean to the small streams and creeks, supporting the growth and health of the surrounding forest environments. Salmon spawning supplies up to 25% of the nitrogen in the production of trees and vegetation, resulting in tree growth rates tripling in areas without salmon runs (Wild Salmon Center, n.d). Salmon also provides food and income for the B.C. population due to local fishing, commercial fisheries and fish farms. Commercial fishing and large fish farms are not beneficial for the salmon population due to overfishing and poor living conditions. Large Corporations located off of the North Shore’s coast have been depleting salmon counts over the last couple decades. The data from the Streamkeepers activities have been observing a decrease in the last ten years. Although salmon fisheries have been creating more job openings and created a broader tourism sector in Vancouver, our data shows they are overexploiting our resources while doing so.
Materials and Methods
In preparation for conducting the salmon survey, which looked at adult salmon, we dressed in either waders or boots based on how deep into the river we were going. We also wore high-visibility vests, sunglasses and took ski poles. We then accessed the river by footpath. Immediately after accessing the river we recorded data, we recorded air and water temperature using a thermometer, we recorded weather, we recorded the water height and turbidity by visual interpretation. We noted all of this data each week by writing all our findings in a notebook we took to the river. After recording all appropriate data the team spread out horizontally across the river and began methodically walking along the river surveying for any salmon. If a salmon was spotted the team would gather to identify, when possible, the species, sex, living or dead and, if it was dead and female, identify the spawning status by cutting the salmon’s underside open with a razor blade to see if any eggs were present. All this information would be recorded in a notebook. At the end of the survey we measured air and water temperature with a thermometer. After the survey we would input all appropriate data into Excel which would be distributed to all rest streamkeepers for analysis and observation.
Results
The data collected in Figure 1 shows common trends in the amount and type of annually returning salmon from 2010-2019. Although the study began in 2006, the data collection of all four salmon species only began in 2010, hence the graph’s nine-year range.
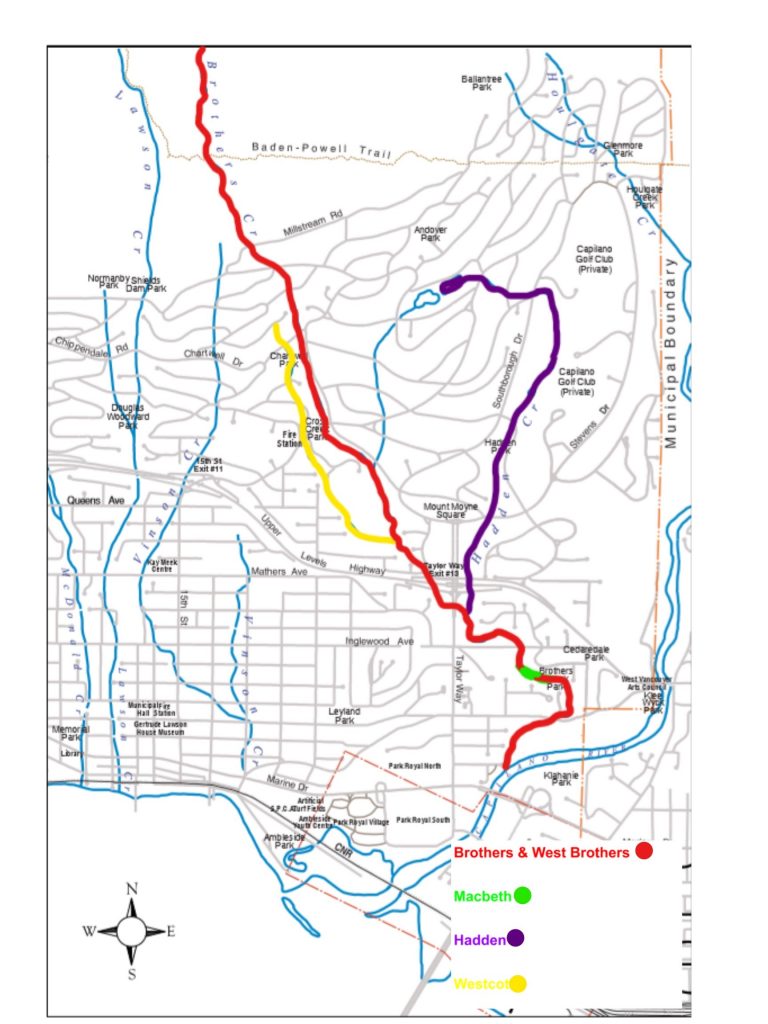
Figure 1. This is a map of West Vancouver, British Columbia including the streams, rivers, and coasts. The Coloured lines are the creeks that connect to Brothers creek and the watershed. The red line is Brothers creek, the green line is Macbeth and the purple line is Hadden creek.
From 2013-2015 the average return of Pink salmon at Brothers Watershed had a 5,024% increase from the previous 3 years, which is followed by a 99% decrease in 2016-2019. This sudden spike is also shown in 2014 with a 4723% increase of returning Chinook salmon followed by a 93% decrease in the following 5 years, and an average rise in chum returns of 82% annually from 2010 to the peak in 2016. In contrast to these trends, Coho returns rose on average 10% yearly from 2010 up until 2014, where the yearly rate decreased on average 14% for the remainder of the survey.
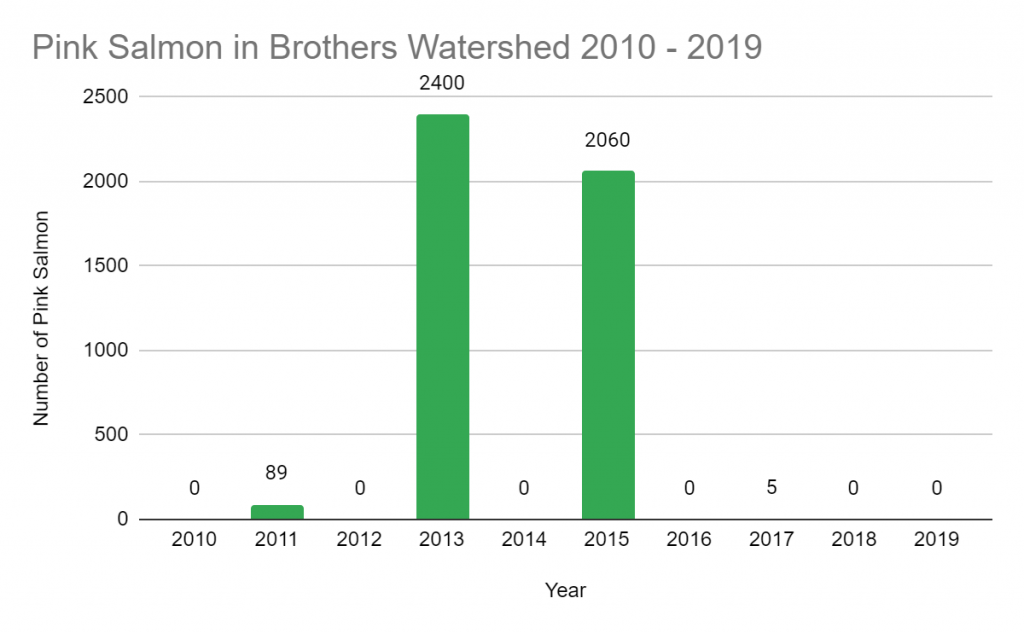
Figure 2. This is the amount of Pink salmon returning to Brothers Watershed from 2010 – 2019
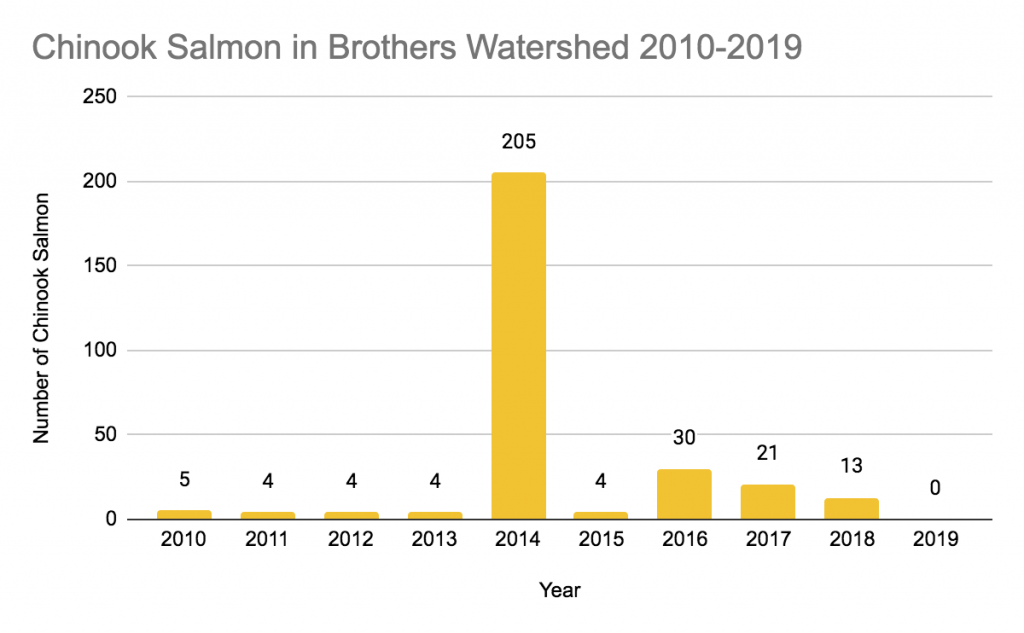
Figure 3. This is the amount of Chinook salmon returning to Brothers Watershed from 2010 – 2019
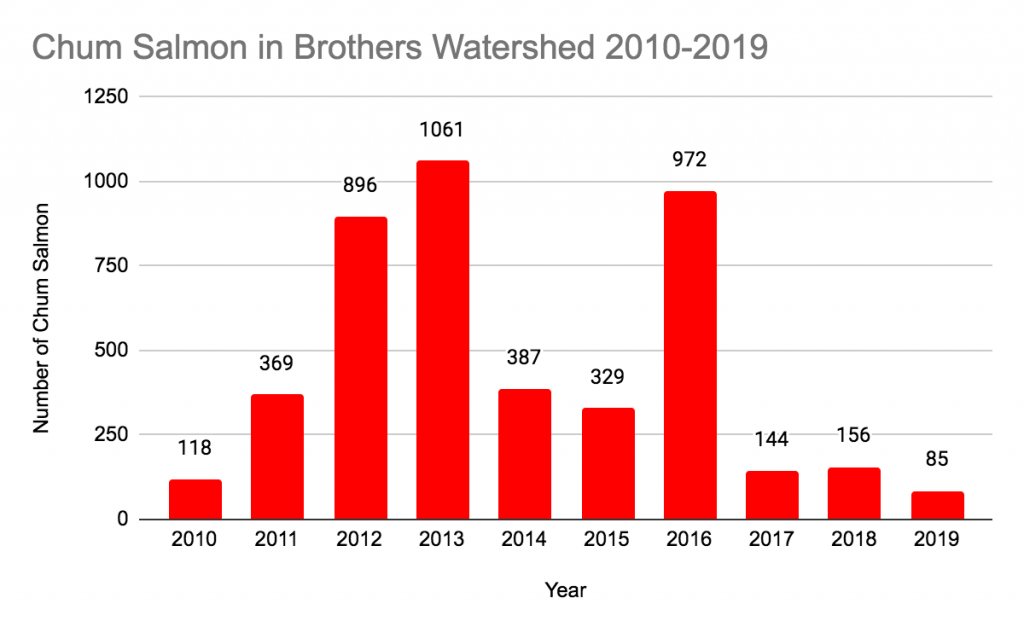
Figure 4. This is the amount of Chum salmon returning to Brothers Watershed from 2010 – 2019
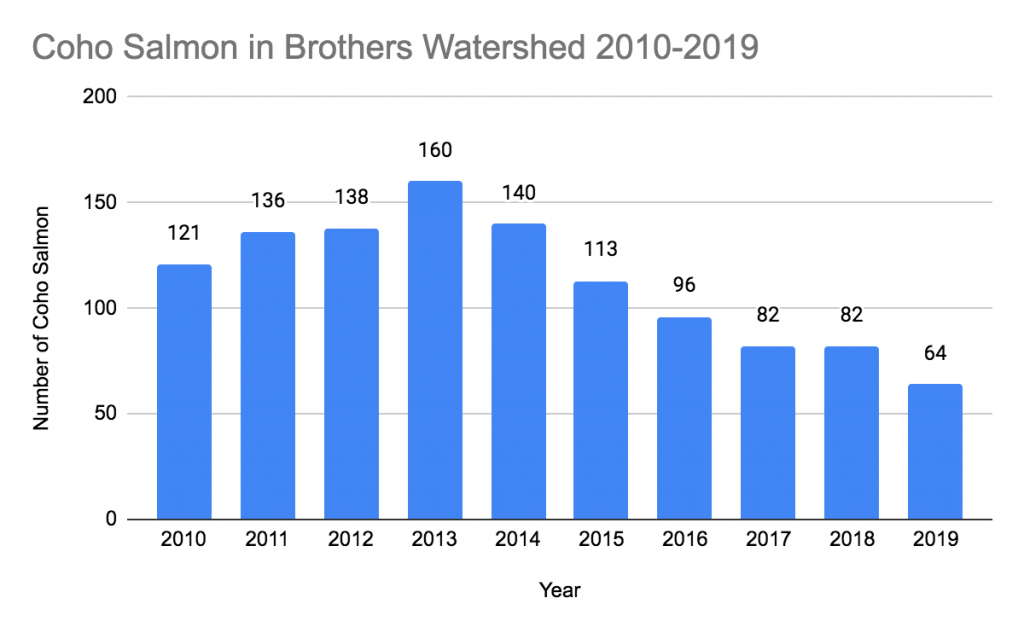
Figure 5. This is the amount of Coho salmon returning to Brothers Watershed from 2010 – 2019.
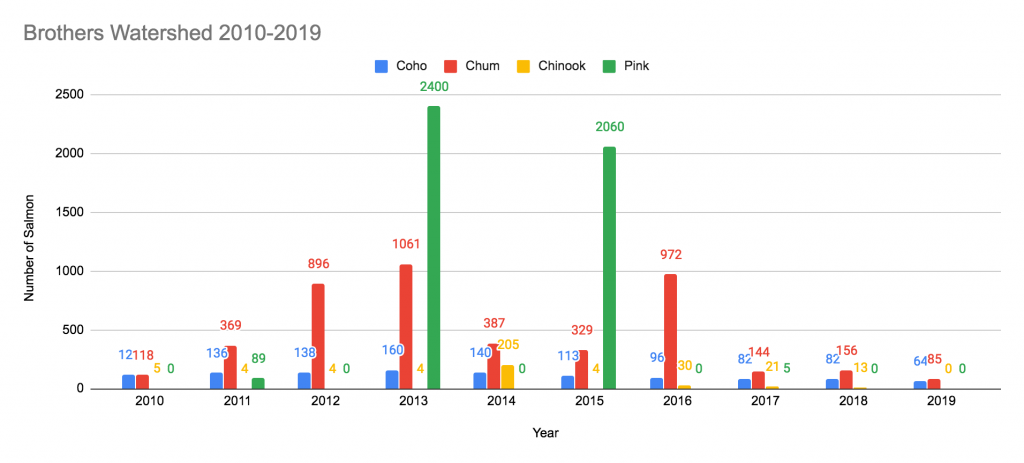
Figure 6. This is the cumulative amount of all the salmon species (Coho, Chum, Chinook, Pink) returning to Brothers Watershed from 2010 – 2019
Discussion
The salmon spawning in British Columbia is being drastically affected by industrialization in metropolitan areas. Data collected from a recent survey conducted at The Brothers Watershed shows this to be true. The survey shows the greatest rise and fall in salmon numbers are that of the Pink and Chinook salmon, increasing then decreasing rapidly after only a few years. It is a similar story with Chinook as well. Noise pollution around the Port of Vancouver has also affected the salmon run with numbers vastly decreasing in the years of Vancouver’s expansion. Another major negative effect on the Salmon in British Columbia is commercial overfishing and the use of fish farms; possibly including the introduction of eastern farmed fish in BC waters. The same data showing significant decrease in salmon populations illustrates that the fish farms are destroying the fragile ecosystem that Salmon need to survive. The fish that are spawned in these farms often escape and terrorize the local communities of fish and spread diseases that kill countless wild salmon. Although fisheries claim the farms and commercial fishing create jobs and are good for the economy the toll on local ecosystems is too great. It is important that when we study the salmon population that we consider the environment, the economy, and human interaction. Streamkeepers play an important role in this; they have been conducting salmon surveys since 2006. Our results show data collected since 2010. Moreover, there are many sources for error in the survey. because students and volunteers are collecting the data, which is then analyzed by scientists. This means that potentially different people collect data each year and many of them are inexperienced and results therefore could be inconsistent. The results of the data collected in the spike years of 2013 and 2015 may have been affected by this variable. Another important note regarding the results data, is to take note of the spike in Chinook salmon in 2014, a year where all other salmon species numbers were low. Researchers might want to explore the question of stream viability; do Chinook need the other salmon populations to be low in order to thrive? Overall, the aspects of rising oceans, rising C02 levels, increased Port Traffic, increased human development, over fishing and salmon farming need to be studied as to how much impact they have on our salmon populations and why. If we continue exploiting resources along the British Columbia coast without considering that changes need to happen soon, our wild salmon will suffer the consequences.
References
“BBC News.” Is There a Problem with Salmon Farming, Lucy Adams, 20 May. 2019, https://www.bbc.com/news/uk-scotland-48266480. Accessed 5 Apr. 2020.
British Columbia Seafood Industry. Canada’s Ministries. British Columbia, BC Ministries, Canada’s Ministries, www2.gov.bc.ca/assets/gov/farming-natural-resources-and-industry/agriculture-and-seafood/statistics/industry-and-sector-profiles/year-in-review/bcseafood_yearinreview_2016.pdf. Accessed 4 Apr. 2020.
“Guidance for Stream Restoration.” Guidance for Stream Restoration, U.S. Forest Service NSAEC, www.fs.fed.us/biology/nsaec/assets/yochumusfs-nsaec-tn102-4guidancestreamrestoration.pdf. Accessed 2 Apr. 2020.
“Our Creeks.” West Vancouver Streamkeeper Society, www.westvancouverstreamkeepers.ca/creeks/index.php.
“Program.” The Pacific Streamkeepers Federation, Pacific Streamkeepers Federation, 4 Feb. 2020, www.pskf.ca/about.php. Accessed 2 Apr. 2020.Rahr, Guido.
“Why Protect Salmon.” The Wild Salmon Center, Wild Salmon Center, 2020, www.wildsalmoncenter.org/why-protect-salmon/. Accessed 4 Apr. 2020.
“The Return of the Salmon.” Vancouverisland.com, Shangaan Webservices, vancouverisland.com/things-to-do-and-see/wildlife-viewing/pacific-salmon-spawning/. Accessed 4 Apr. 2020.
“Salmon Life Cycle.” Stream Explorers, Trout Unlimited, www.streamexplorers.org/fish-facts/salmon-life-cycle. Accessed 2 Apr. 2020.