Ingrid Wu, Year 2 Engineering.
Abstract
In aeronautics, understanding the components which allow aerodynamic stability of a wing is crucial in ensuring that little energy is wasted when moving forward. This work investigates three main factors which are critical to aircraft performance: angle of attack, planform shape and aspect ratio. Two different wing models, rectangular planform and tapered planform, keeping equal surface area, were simulated in the Airtech 40 Wind Tunnel (Pitsco). Both models were analyzed at an air velocity of 15 m/s and at an air density of 1.2754 kg/m3. The coefficients and lift and drag were calculated and compared at various different angles ranging from 0o to 20o. The results show that the tapered wing planform has higher lift coefficients and lower drag coefficients than the rectangular wing planform at all angles. The tapered wing design had a greater aspect ratio, decreasing the induced drag, and consequently increasing the lift to drag ratio.
Introduction
The wings of an airplane are inarguably one of the most critical components of an airplane. They work to generate lift, allowing the plane to be able to navigate from one destination to another, carrying thousands of hundreds of passengers per day.
By creating and applying an optimal wing shape to existing planes, we are able to increase the lift (Hall 2018), decrease the drag (Adam 2005), decrease the force needed for thrust (Hutchinson 1996), decrease runway distances and as a result, optimize engine fuel consumption (Lockney). When aeronautic engineers create a wing model, it is crucial to understand the components which make up the aerodynamic stability of a wing. Additionally, in creating an optimal wing, many external factors come into play such as ensuring little energy is wasted moving forward, as well as minimizing the amount of material used to create the wing.
This project aims to compare the efficiency of my wing airfoil design to an existing design, the NACA (National Advisory Committee for Aeronautics airfoils) 2421, by comparing their coefficients of lift at different angles of attack in the Airtech 40 wind tunnel (Pitsco). Two different wing planforms, a rectangular planform and a tapered planform, the NACA design and my design respectively, were tested in a wind tunnel. The inspiration for my specific wing was drawn from a combination of the tapered and sweptback wing designs. By keeping the amount of surface material used for both wings constant, I am able to identify which factors are integral to create the optimal wing, while minimizing the material used. This work investigates multiple factors affecting lift, including maximum and minimum angles of attack, aspect ratio, and shape of the wings’ planforms. I place the differently molded wings into a wind tunnel, provided with permission at my school, and compare the different lift forces in Newtons of each wing compared to angle of attack, drag and wing shape. I have chosen these variables because the formulas for Lift and Drag of a wing measured in Newton forces are:
L = CL 0.5d a v2
and
D = CD 0.5d af v2
where d represents density of air, a represents the plan area of the wing, af represents the frontal area of the wing, v represents velocity, and CL and CD represent coefficient of lift and drag respectively. This formula appears in Bernoulli’s theory of pressure. CL, the lift coefficient is a number that models the alterations of shape, inclination and flow conditions such as density, pressure and velocity of wind.
In an experiment (Lewis et al. 2010), the researchers investigated the ratio between lift and drag. They explore with far more technologically advanced apparatus; in their experiment, there is an onboard computer which monitors the sensed conditions and parameters, indicating the desired positions for the leading and trailing edge surfaces necessary to achieve a wing camber that optimizes the wing lift/drag (L/D) ratio during aircraft operation.
Materials and Methods
The wing designs were designed using Fusion 360 (Autodesk), a computer-aided design program. Following the standard method of testing wings used by numerous aerodynamicists at NASA (Hall 2015), the 3D-printed wings were placed in a wind tunnel and tested for its lift and drag.
For the first wing design, an extension of Fusion 360, “Airfoil DAT to Spline”, was used to transform the coordinates of an existing wing model, the NACA 2421, into a file readable by Fusion 360. The coordinates were then transformed into a 3D model (Fig. 1). In designing the second wing, sketches of the top and side views were created separately (Fig. 2). The top and bottom parts of the wing were separated (Fig. 3), then converted into a solid. The two solids were recombined to facilitate the 3D printing process.
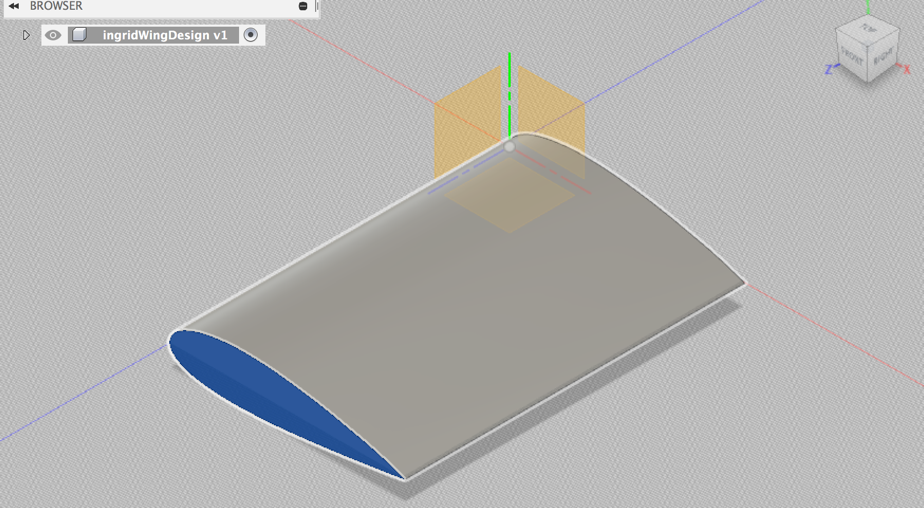
Figure 1. Three-dimensional prototype of first wing design in Fusion 360 (Autodesk). Using the CAD program to develop a 3D model before printing enabled quick ratio and dimension adjustments, as well as values of surface area for calculations of Lift and drag coefficient.
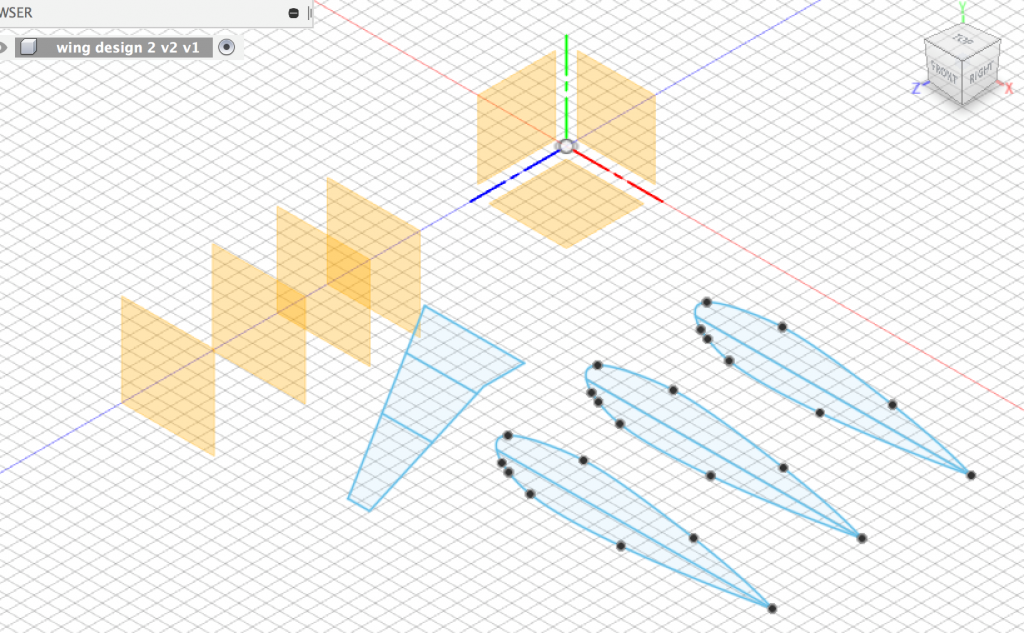
Figure 2. Design process of second wing in Fusion 360 (Autodesk). Sketches of each individual view panes were created separately to ensure that the coordinates were scaled, and lined-up accordingly.
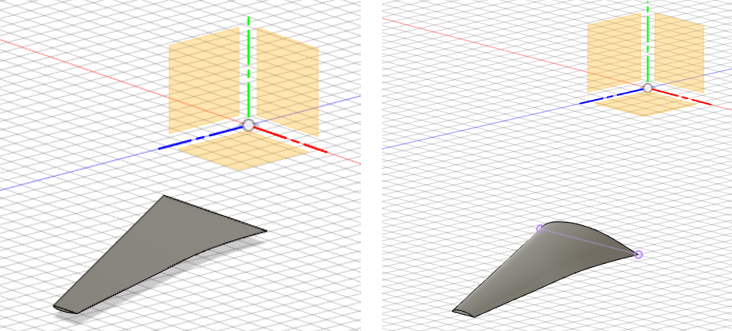
Figure 3. Three-dimensional prototype of second wing design in Fusion 360 (Autodesk). The top and bottom parts of the wing were separated first, in order to be converted to a solid three-dimensional model. These parts were then re-combined for printing.
The two designs were finalized on Fusion 360 and saved as STL files in order to be 3D printed (Fig. 4). The two wings were modeled using a 3D printer (Tinkerine Ditto Pro). The material used was PLA, polyadic acid, plastic and the wings were printed in full resolution which resulted in smoother surfaces and increased the overall aerodynamic flow of the wing. Following the designing and printing processes, the wings were placed inside the Airtech 40 wind tunnel (Pitsco) as shown in Fig. 5.
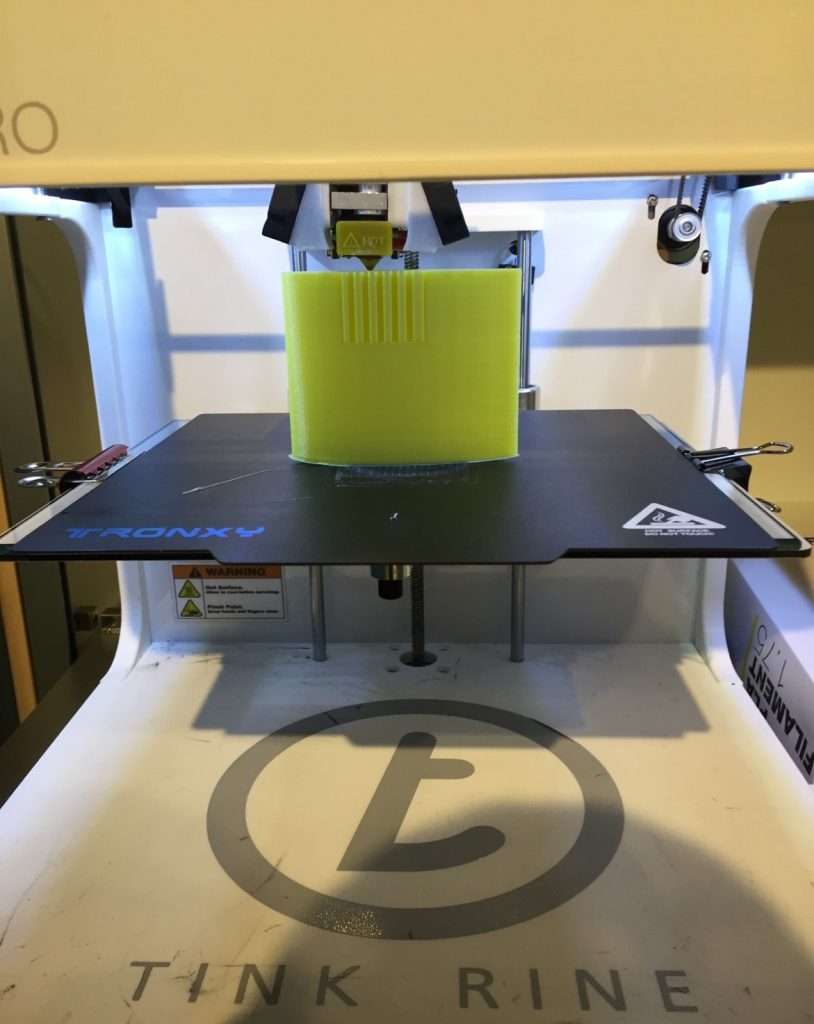
Figure 4. 3D-printing process of first wing design. The two wings were modeled using a 3D printer (Tinkerine Ditto Pro) using polyadic acid, each taking three hours to print out.
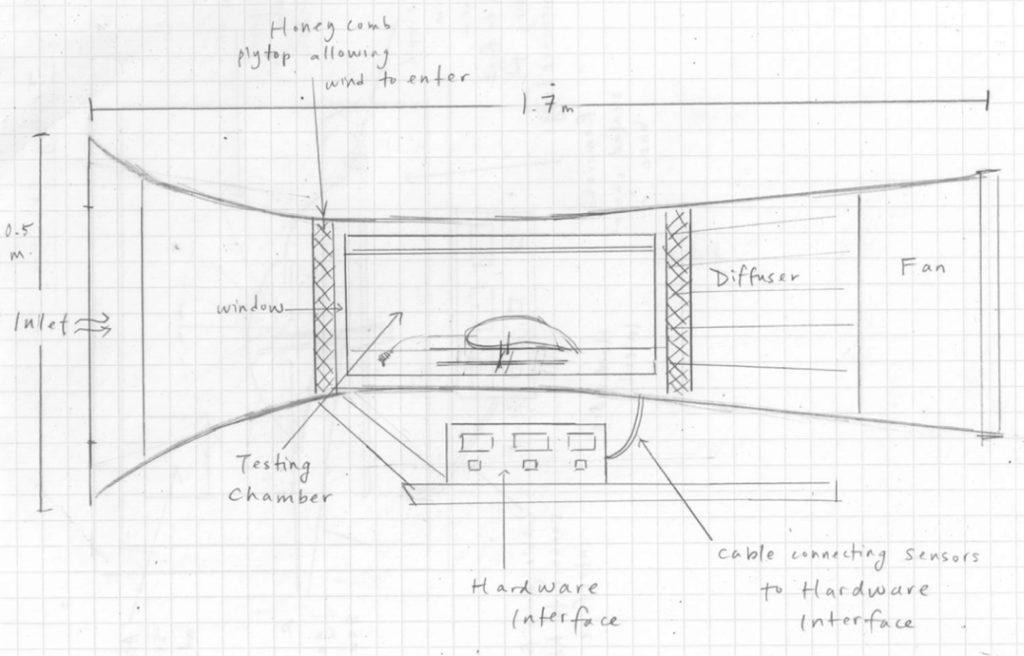
Figure 5. A side view of the wing inside the wind tunnel. The Airtech 40 wind tunnel measures approximately 1.5m long by 0.7m tall. It consists of multiple different components including a testing chamber, a fan motor, a sensor displaying values of lift and drag, and a hardware interface.
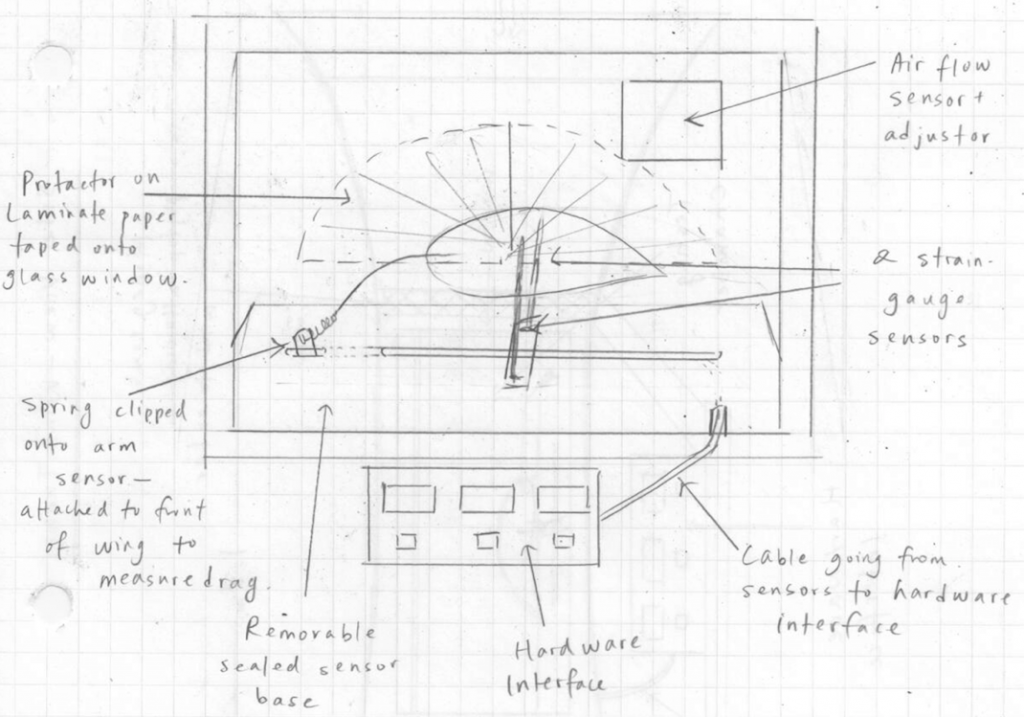
Figure 6. Close-up side view of wing inside testing chamber. The chamber consists of an air flow sensor (propeller), an arm sensor with a wire attached to measure drag, adjustable weight sensors for measuring lift, two strain-gauges, and a removeable sensor base with a cable going to the hardware interface. A large protractor cut-out was attached to the panel to adjust the angle of attack of the wings.
Inside the testing chamber of the wind tunnel (Fig. 6), a mutli-axis sensor, a device which measures the amount of lift in Newtons, was connected to the two strain-gauges. A metal piece, which is attached to the strain-gauge wires, increased or decreased in length, proving either a larger or smaller strain force. A third wire, attached to a spring scale, was connected to the wing from the front to measure the amount of drag. A large protractor cut-out was attached to the panel, and the angle was altered in increasing increments of 5 degrees until the angle no longer had an effect on the lift. The wings were tested at a wind speed of 15m/s inside the wind tunnel.
After all the data was collected, results were analysed, and calculations of lift coefficient and drag coefficient were done utilizing the following relationships:
L = CL 0.5d a v2
and
D = CD 0.5d af v2
The variation of lift coefficient at different angles of attack are plotted and it is observed that the lift coefficient for the tapered wing design is slightly larger than the lift coefficient for the rectangular NACA 2421 wing at every angle of attack (Fig. 7). The stall angle of attack for both wings remains in the range 15o to 20 o. The values of drag coefficient for the tapered wing is lower than that of the rectangular wing for all angles of attack (Fig. 8). The relationship between coefficient of drag and angle of attack increases exponentially.
The values of lift to drag ratio are plotted in Fig. 9, which shows that the lift to drag ratio of the tapered wing is greater than the ratio of the rectangular wing. The maximum ratio value is observed to be at an angle of attack of 5o for the tapered wing and at 10o for the rectangular wing. Both planforms show an increase, stall, then decrease in the shape of the curve.
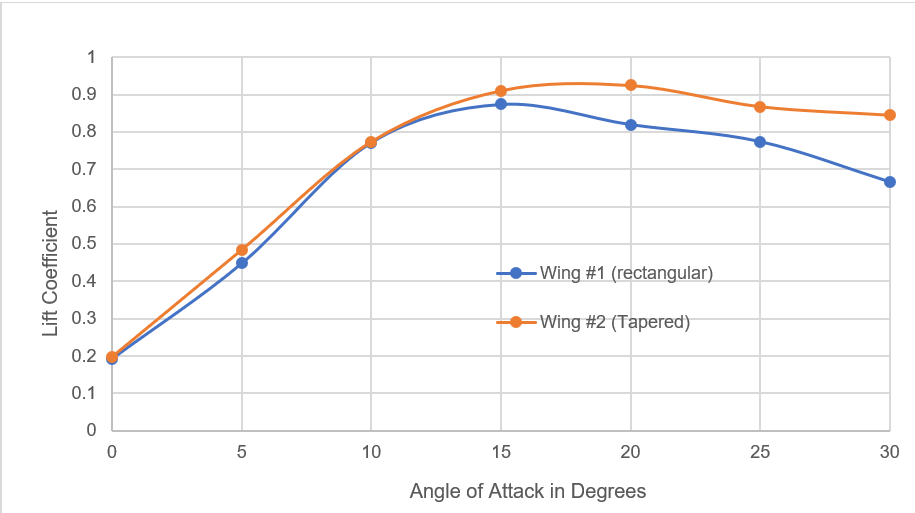
Figure 7. Graph correlating lift coefficient and angle of attack for both the rectangular and tapered wing designs, or, the first and second designs respectively.
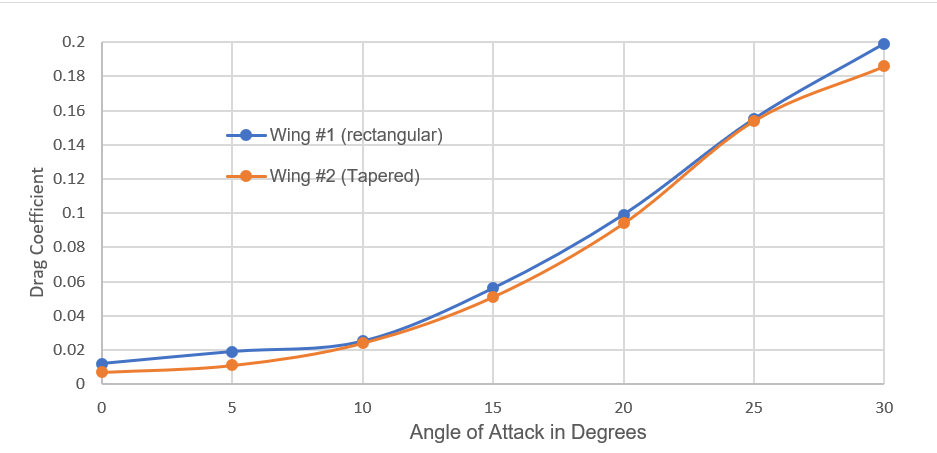
Figure 8. Graph correlating drag coefficient and angle of attack for both the rectangular and tapered wing designs, or, the first and second designs respectively.
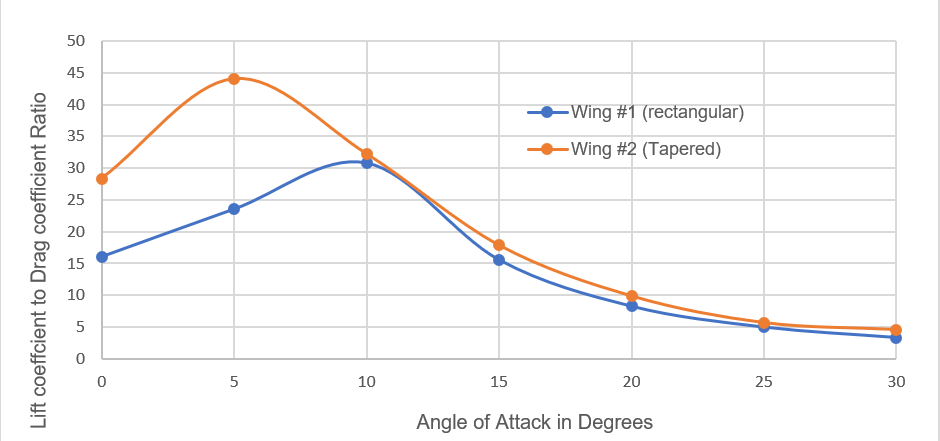
Figure 9. Graph correlating the ratio of lift coefficient to drag coefficient.
Discussion
Both the planform and rectangular designs were constructed and altered in such a way that they have the same surface area. The planform surface area of the tapered wing increases towards the root of the wing, and decreases towards the tip of the wing, while the planform surface area of the rectangular wing remains constant from root to tip. As a result, the tapered wing can produce more lift due to its increased surface area near the root.
Another interpretation for greater lift results in the tapered wing is understood by looking at the aspect ratio of the wings. The Aspect Ratio of a wing is defined to be the square of the span divided by the wing area and is given by the symbol AR. The aspect ratio does not affect the coefficient of lift, as it is not a variable in the lift equation. The lift coefficient is a function of the Angle of Attack and the shape of the airfoil. The aspect ratio affects the induced drag of the wing, and as a result, alters the overall lift to drag ratio. By increasing the wingspan and shortening the chord length, the surface area is kept constant and the AR increases. Consequently, the induced drag is decreased because there is less vortex induced downwash (Hall 2015). As drag decreases, the overall lift, or lift to drag ratio, increases.
In an experiment which analyses the aerodynamic stability of different wing planforms (Dwivedi et al. 2013), the results support that the tapered planform wing is found to be the most aerodynamically stable wing in all range of speeds and angle of attack, while the rectangular planform wing is the second most stable. Analysing upon both their results and my results, there is a possible correlation between the lift and drag of a wing versus its aerodynamic stability.
In conclusion, the tapered wing planform has higher lift coefficient values and lower drag coefficient values than the rectangular wing. As a result, the tapered wing has a higher lift to drag ratio than the rectangular wing. Due to the tapered wing having a longer wingspan, and thus a greater Aspect Ratio, factors such as maneuverability and stability of a plane are optimized. The increased cross-sectional area of the tapered wing at its root, where the twist of the wing is greatest, makes the wing torsionally stiffer. This allows for greater stability as the wing moves at higher speeds.
While this work shows a definite distinction between the two wing planforms, the results would likely be different and more accurate had the experiment been done with life sized models, as well as a more sensitive wind tunnel. For instance, had I analyzed the pressure and shear stress distribution around the wing surface area as another research investigating a similar experiment had done (Khan and Faruk 2018), I would have been able to locate visually and more precisely how the wind flows around the airfoil. Additionally, both wings were analyzed as a whole, that is, not by individual parts. In order to concentrate on planform effect only, section modifications and analysis as well as advanced high-lift devices would allow more accurate and precise results. While it was assumed that the greater lift produced by the tapered wing was due to the planform shape, many factors including the slight deformity or differences of airfoil, induced drag, difference of air pressure at different times, and the specific complexities of the strain-gages connected to the wing tunnel could have altered the results significantly.
References
Dwivedi, Y D, et al. “Experimental Aerodynamic Static Stability Analysis of Different Wing Planforms.” International Journal of Advancements in Research & Technology, vol. 2, no. 6, 2013.
Hall, Nancy. “Downwash Effects on Lift.” National Aeronautics and Space Administration, 5 May. 2015, https://www.grc.nasa.gov/www/k-12/airplane/downwash.html.
Hall, Nancy. “Shape Effects on Lift.” National Aeronautics and Space Administration, 5 Apr. 2018, https://www.grc.nasa.gov/www/k-12/airplane/tuntest.html.
Hall, Nancy. “Wind tunnel testing.” National Aeronautics and Space Administration, 5 May. 2015, https://www.grc.nasa.gov/www/k-12/airplane/tuntest.html.
Hutchinson, John R. “Vertebrate Flight.”Basic Flight Physics, University of California Museum of Paleontology, ucmp.berkeley.edu/vertebrates/f light/physics.html.
Khan, Md. Monirul Islam, et al. “Comparative Analysis of Aerodynamic Characteristics of Rectangular and Curved Leading Edge Wing Planforms.” American Journal of Engineering Research (AJER), vol. 7, no. 5, 2018, pp. 281-291.
Lewis, George E., et al. “Wing Lift/Drag Optimizing System.” US4,899,284 A, United States Patent, 6 Feb. 1990, https://patentimages.storage.googleapis.com/18/c5/df/8da01f05049799/US4899284.pdf.
Lockney, Dan. “Green aviation – improved aerodynamic efficiency and less fuel burn.” National Aeronautics and Space Administration, technology.nasa.gov/patent/TOP2-200.
“Theory of Flight.” MIT Department of Aeronautics and Astronautics, 16 Mar. 1997, web.mit.edu/16.00/www/aec/flight.html.